%matplotlib Notebook
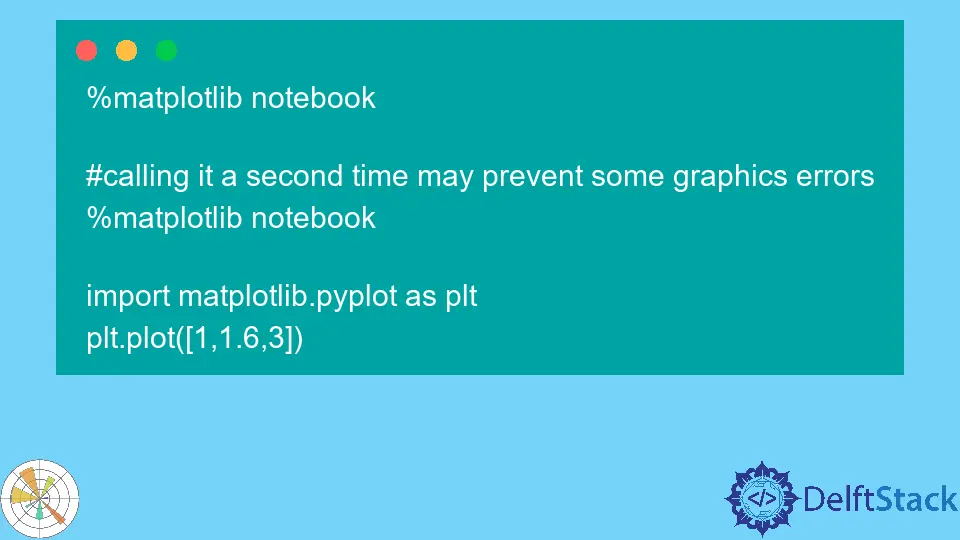
Matplotlib’s notebook graph is an interactive graph that can be utilized to draw and edit figures in a Jupyter notebook. With this graph, you can add or remove elements from the figure, change the colors and styles of elements, and save the figure to a file. You can also easily create stunning visuals that can be used in reports, presentations, and more from the %matplotlib notebook. It will enable the interactive mode in Matplotlib, allowing you to zoom, pan, and scroll through plots.