How to Display Greek Letters in Python Matplotlib
-
Use the Raw Strings and
$Sign to Show Greek Letters Withmatplotlibin Python -
Use the
chr()Function With Unicode to Show Greek Letters Withmatplotlibin Python -
Use the Literal Strings With Unicode Characters to Show Greek Letters With
matplotlibin Python -
Use
mpl_text.TextPathto Show Custom Labels With Greek Letters in Matplotlib - Conclusion
Matplotlib is a powerful plotting library in Python commonly used for creating visualizations in various scientific and data-driven applications. Sometimes, it’s necessary to include Greek letters or symbols in your plots to denote variables or mathematical notations.
In this article, we will explore how to display Greek letters in Matplotlib using Python.
Use the Raw Strings and $ Sign to Show Greek Letters With matplotlib in Python
Matplotlib has an integrated expression parser and layout engine that enables LaTeX-like syntax for displaying Greek letters. By using raw strings (preceded by the r character), we can enclose Greek letters in $ signs within these strings, representing them accordingly.
But before using LaTeX-style formatting, ensure that it’s enabled in Matplotlib by setting the appropriate configuration option:
import matplotlib.pyplot as plt

plt.rcParams["text.usetex"] = True
You can now use LaTeX-like expressions for labels, annotations, or titles. For example,
import matplotlib.pyplot as plt

# Plot title with Greek letter alpha
plt.title(r"$\alpha$")

# Display the plot
plt.show()
Here, we start by importing the Matplotlib library, which is a fundamental step to access its functionality for plotting.
import matplotlib.pyplot as plt
To display the Greek letter alpha (α) using LaTeX-like syntax with raw strings, we use the title function from Matplotlib. We pass a raw string as the title, encapsulating the Greek letter alpha using $ signs and the letter’s name preceded by a backslash.
plt.title(r"$\alpha$")
Finally, we use the show function to display the plot with the specified title containing the Greek letter alpha.
plt.show()
Output:

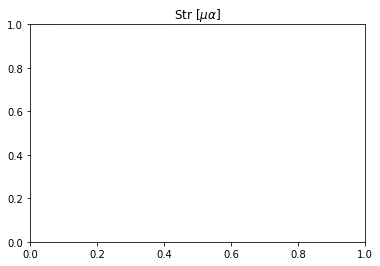
Multiple letters can also be combined within strings by enclosing them in square brackets and maintaining the desired order.
See the example below.
import matplotlib.pyplot as plt

plt.title(r"Str [$\mu \alpha$]")
Output:
Use the chr() Function With Unicode to Show Greek Letters With matplotlib in Python
Greek letters are Unicode characters, and their respective Unicode code points range from 945 to 969 for the small Greek letters. In Python 3, we can use the chr() function to obtain the Unicode character corresponding to a specific code point and use it in our Matplotlib plots.
For example,
import matplotlib.pyplot as plt

# Plot title with Greek letter alpha
plt.title(chr(945))  # Unicode code point for alpha

# Display the plot
plt.show()
Output:

The chr() function in Python takes an integer (representing a Unicode code point) as an argument and returns the Unicode character corresponding to that code point.
To display the Greek letter alpha (α) using this method, we use chr(945) since 945 is the Unicode code point for alpha.
Finally, we use the show function to display the plot with the specified title containing the Greek letter alpha.
Use the Literal Strings With Unicode Characters to Show Greek Letters With matplotlib in Python
Another approach to display Greek letters is by utilizing Unicode characters directly. In Python 3 and above, Greek letters are available as Unicode characters, making it easy to incorporate them into Matplotlib plots.
This is a valuable feature when creating plots with mathematical notations or scientific content.
For example,
import matplotlib.pyplot as plt

# Plot title with Greek letter alpha
plt.title("α")

# Display the plot
plt.show()
Output:

To display the Greek letter alpha (α) using Unicode characters, we simply include the Unicode character for alpha directly within the title string.
plt.title("α")
The 'α' in the title represents the Unicode character for the Greek letter alpha, displayed directly within the string.
Finally, we use the show function to display the plot with the specified title containing the Greek letter alpha.
In Python 2, you can achieve the same result by importing unicode_literals from the __future__ module and using the Unicode characters.
For example,
from __future__ import unicode_literals
import matplotlib.pyplot as plt

plt.title("α")
Use mpl_text.TextPath to Show Custom Labels With Greek Letters in Matplotlib
For more complex scenarios or custom designs, you can use mpl_text.TextPath to create custom labels with Greek letters. This approach allows you to have fine-grained control over the appearance and positioning of the characters.
Here’s the complete working code:
from matplotlib.textpath import TextPath
from matplotlib.patches import PathPatch
import matplotlib.pyplot as plt

# Create a TextPath object for the label 'α-beta'
text_path = TextPath((0, 0), "α-beta", size=24, usetex=False)

# Create a PathPatch from the TextPath
path_patch = PathPatch(text_path, lw=0, color="blue", alpha=0.5)

# Create a figure and axis
fig, ax = plt.subplots()

# Add the PathPatch to the axis
ax.add_patch(path_patch)

# Set the limits and labels
ax.set_xlim(0, 100)
ax.set_ylim(0, 100)
ax.set_xlabel("X-axis")
ax.set_ylabel("Y-axis")

plt.show()
In this example, we created a TextPath object for the label α-beta with a font size of 24. The usetex=False parameter indicates that we are not using LaTeX rendering.
We then created a PathPatch from the TextPath object, specifying the line width, color, and transparency of the patch.
When you run this code, it will display a plot with a custom label α-beta using the TextPath and PathPatch approach. You can modify the label text, colors, transparency, and other parameters to suit your preferences.
Conclusion
In summary, this tutorial showcased multiple methods to integrate Greek letters into Matplotlib plots. Using raw strings with LaTeX-like syntax, the chr() function for Unicode characters, or direct Unicode inclusion, we achieved diverse approaches for displaying Greek letters.
Additionally, we introduced the advanced mpl_text.TextPath for intricate custom labels. These techniques enhance data visualization, adding clarity and sophistication to Matplotlib plots.

Manav is a IT Professional who has a lot of experience as a core developer in many live projects. He is an avid learner who enjoys learning new things and sharing his findings whenever possible.
LinkedIn