%matplotlib Notebook
Matplotlib’s notebook graph is an interactive graph that can be utilized to draw and edit figures in a Jupyter notebook. With this graph, you can add or remove elements from the figure, change the colors and styles of elements, and save the figure to a file.
You can also easily create stunning visuals that can be used in reports, presentations, and more from the %matplotlib notebook. It will enable the interactive mode in Matplotlib, allowing you to zoom, pan, and scroll through plots.
What Is %matplotlib notebook
A %matplotlib notebook is a powerful method that allows you to conveniently create and share your plots and visualizations with others.
Some of the essential features of matplotlib are:
- It supports many devices, such as printers, display screens, and interactive graphical environments (notebooks, web application servers, etc.).
- It is a comprehensive set of plotting functions for creating static, animated, and interactive 2D and 3D plots.
- It is the best tool for integrating Matplotlib with popular GUI toolkits like
QtandwxPython. - It supports generating high-quality output in several formats, including
PNG,JPG,EPS,SVG, andPDF.
The %matplotlib notebook magic command creates interactive plots in a Jupyter notebook. Type %matplotlib notebook at the beginning of a Jupyter notebook cell to use this magic command.
The %matplotlib notebook magic command is designed to provide an interactive plotting experience, and it is beneficial for exploring data and creating visualizations.
There are a few reasons for creating the %matplotlib notebook magic command.
- First, it allows users to easily and quickly create interactive plots in the Jupyter Notebook.
- Second, sharing these plots with others via the Jupyter Notebook view or by exporting them to a file makes it possible.
- Finally, the
%matplotlib notebookmagic command is a convenient way to access the Matplotlib API.
%matplotlib inline vs %matplotlib notebook
If you’re using Jupyter Notebook to create plots, you’ll need to decide whether to use the %matplotlib inline or %matplotlib notebook magic commands.
Both of these commands will embed your plot into the notebook, but they have different consequences for interactivity.
%matplotlib inline
The %matplotlib inline will embed your plot into the notebook as a static image. It is recommended to display plots in Jupyter Notebook, as it will ensure that your plot is always up-to-date with the data you’re using.
However, because the plot is static, you will not be able to interact with it like zoom in or out, pan, etc. But %matplotlib inline is great when you want preliminary data exploration and need the results to show up quickly.
Code:
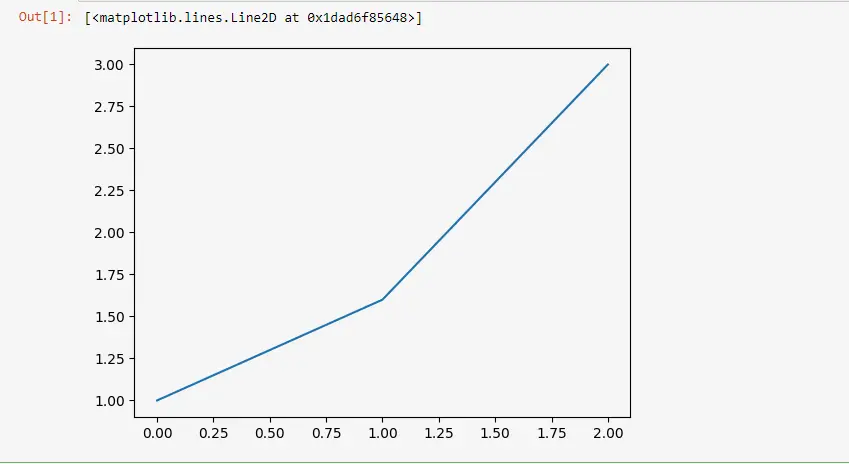
# %matplotlib inline
import matplotlib.pyplot as plt

plt.plot([1, 1.6, 3])
Output:
%matplotlib notebook
The %matplotlib notebook will embed your plot into the notebook as an interactive widget. It means you can interact with the plot, but it may not always be up-to-date with the data you’re using.
If you’re using %matplotlib notebook, it’s important to be aware of this trade-off and decide whether the interactivity is more important than the up-to-datedness of plot. However, it’s better to share the results with others.
There are a few reasons why the %matplotlib notebook is better for sharing the results with others.
- It is interactive, meaning people can play with the data and see the results themselves.
- Second, it is easy to save and share notebooks so others can access the results.
- Finally, the notebook format is easy to read and understand so that people can follow the analysis.
Code:
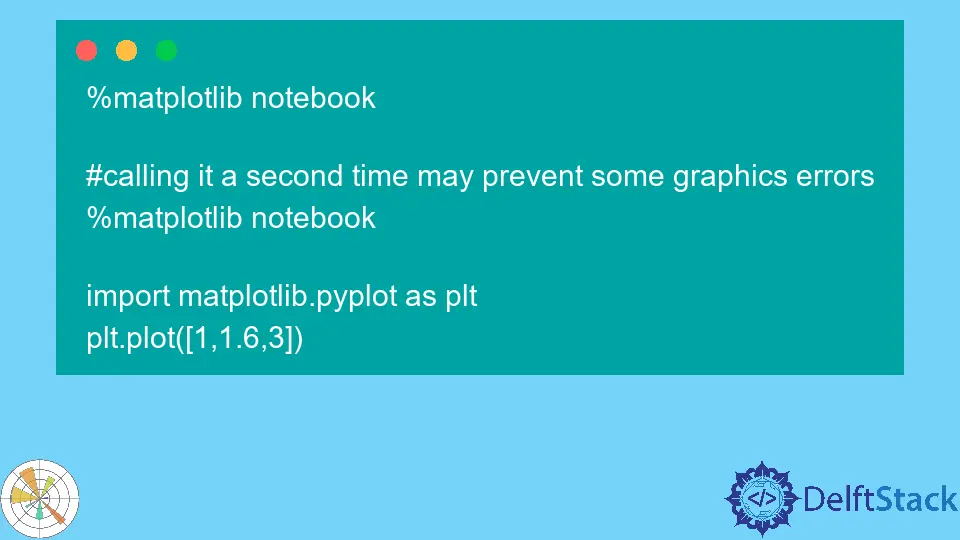
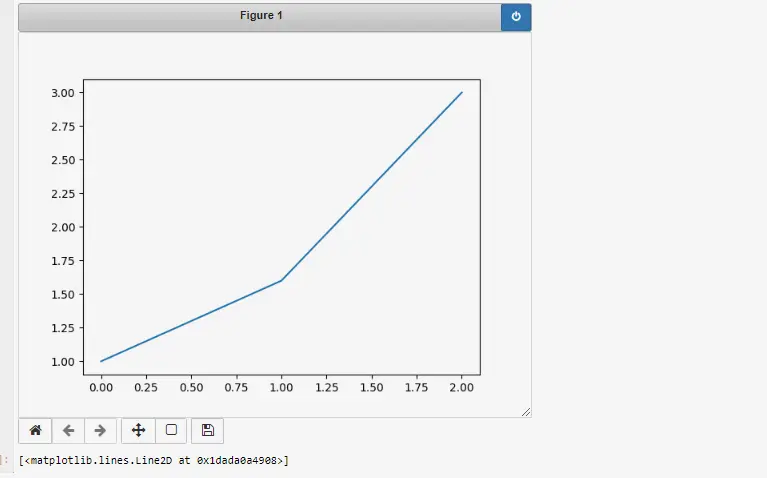
%matplotlib notebook

#calling it a second time may prevent some graphics errors
%matplotlib notebook

import matplotlib.pyplot as plt
plt.plot([1,1.6,3])
Output:
Conclusion
There are two ways to render plots in Python, and each method has its benefits. The usage of %matplotlib notebook is suggested because it allows you to see the plots in line with the rest of the code.
Further, it helps interact with plots by panning and zooming to investigate points of interest.

Zeeshan is a detail oriented software engineer that helps companies and individuals make their lives and easier with software solutions.
LinkedIn