如何在 Matplotlib 中改變子圖的大小和間距
我們可以使用 tight_layout(),subplots_adjust() 和 subplot_tool() 方法來更改 Matplotlib 中許多子圖的子圖大小或間距。我們還可以通過在 subplots() 函式中設定 constrained_layout=True 來更改子圖間距。
2023年1月30日
Matplotlib
Matplotlib Subplot
Tags
Matplotlib Line Matplotlib Figure Matplotlib Axes Matplotlib Ticks Matplotlib Legend Matplotlib Scatter Plot Matplotlib Color Matplotlib Histogram Matplotlib Subplot Matplotlib Axis Matplotlib Scatter Matplotlib Title Matplotlib Save Matplotlib Diagram Matplotlib Plot Matplotlib Shape Matplotlib Colorbar Matplotlib Images Matplotlib Visualizations Matplotlib Lines最受歡迎文章

在 Matplotlib 中設定 X 軸刻度值
2020年11月24日
Matplotlib
Matplotlib Axes

如何在 Matplotlib 中設定軸的範圍
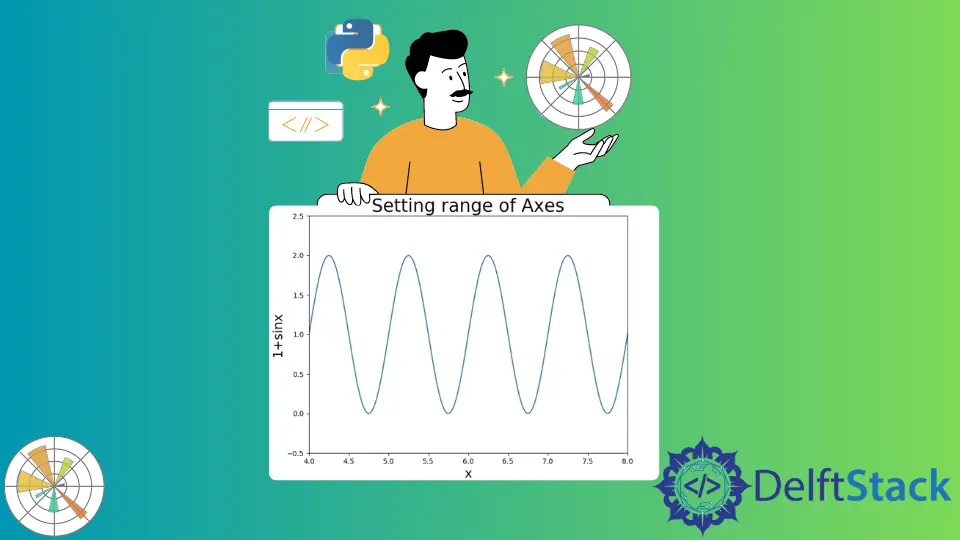
2023年1月30日
Matplotlib
Matplotlib Axes

如何在 Matplotlib 中更改圖形大小
2023年1月30日
Matplotlib
Matplotlib Figure

如何在 Matplotlib 中以高解析度繪製和儲存圖形
2023年1月30日
Matplotlib
Matplot Save

如何在 Matplotlib 中畫一條任意線
2023年1月30日
Matplotlib
Matplotlib Lines

如何在 Matplotlib 中繪製水平和垂直線
2023年1月30日
Matplotlib
Matplotlib Line

在 Matplotlib 中隱藏座標軸、邊框和空白
2023年1月30日
Matplotlib
Matplotlib Axes
最新的文章

在 Matplotlib 條形圖上新增值標籤
2023年1月30日
Matplotlib
Matplotlib Bar Chart

Python Matplotlib 圖中的上標
2022年5月14日
Matplotlib

使用 Python Matplotlib 繪製向量
2023年1月30日
Matplotlib

使用 Python Matplotlib 建立歸一化直方圖
2022年5月11日
Python

使用 Matplotlib 建立多個子圖
2023年1月30日
Matplotlib
Matplotlib Subplot

在 Matplotlib 中繪製日期
2023年1月30日
Matplotlib
Matplotlib Plot