如何在 Matplotlib 中繪製水平和垂直線
-
axhline及axvline在 Matplotlib 中繪製水平和垂直線 -
hlines及vlines在 Matplotlib 中繪製水平和垂直線 - 在 Matplotlib 中繪製水平和垂直線的結論
- Conclusion of drawing horizontal and vertical lines in Matplotlib
在本教程中,我們將介紹兩種在 Matplotlib 中繪製水平和垂直線條的方法。這兩種方法在 Matplotlib 中使用不同的座標系統。
axhline()/axvline()hlines()/vlines()
axhline 及 axvline 在 Matplotlib 中繪製水平和垂直線
axhline 畫一條水平線
matplotlib.pyplot.axhline(y=0, xmin=0, xmax=1, hold=None, **kwargs)
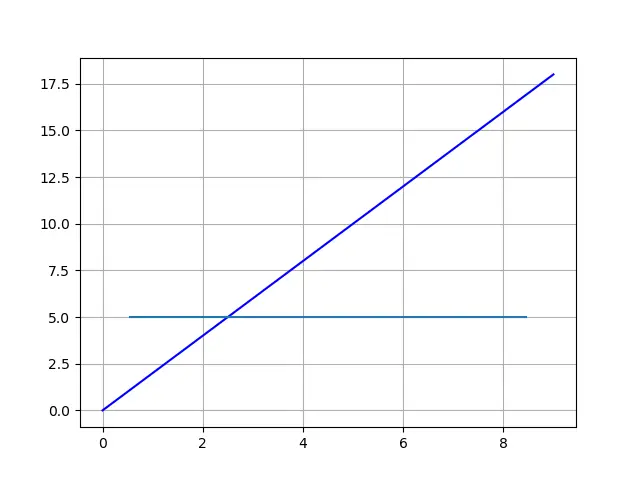
axhline 在水平線的 y 資料座標中的位置處繪製一條水平線,從 xmin 到 xmax,該點應位於 0.0 和之間 1.0,其中 0.0 是圖的最左側,1.0 是圖的最右側。
from matplotlib import pyplot as plt

xdata = list(range(10))
ydata = [_ * 2 for _ in xdata]

plt.plot(xdata, ydata, "b")

plt.axhline(y=5, xmin=0.1, xmax=0.9)

plt.grid()
plt.show()
axvline 畫一條垂直線
同樣,
matplotlib.pyplot.axvline(x=0, ymin=0, ymax=1, hold=None, **kwargs)
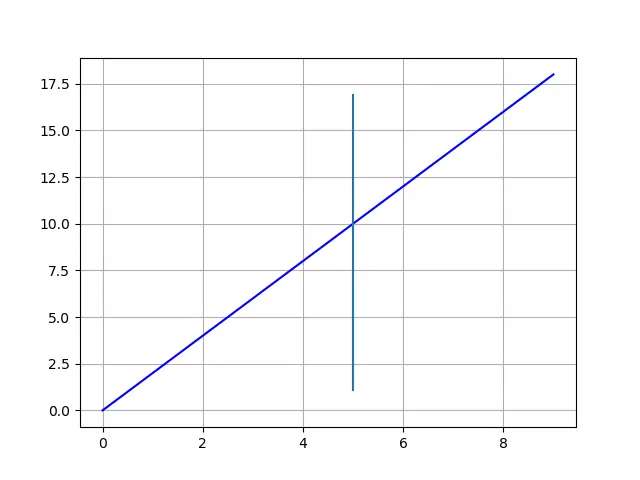
axvline 在垂直線的 x 資料座標中的位置處繪製一條垂直線,從 ymin 到 ymax,該點應在 0.0 和之間 1.0,其中 0.0 是圖的底部,1.0 是圖的頂部。
from matplotlib import pyplot as plt

xdata = list(range(10))
ydata = [_ * 2 for _ in xdata]

plt.plot(xdata, ydata, "b")

plt.axvline(x=5, ymin=0.1, ymax=0.9)

plt.grid()
plt.show()
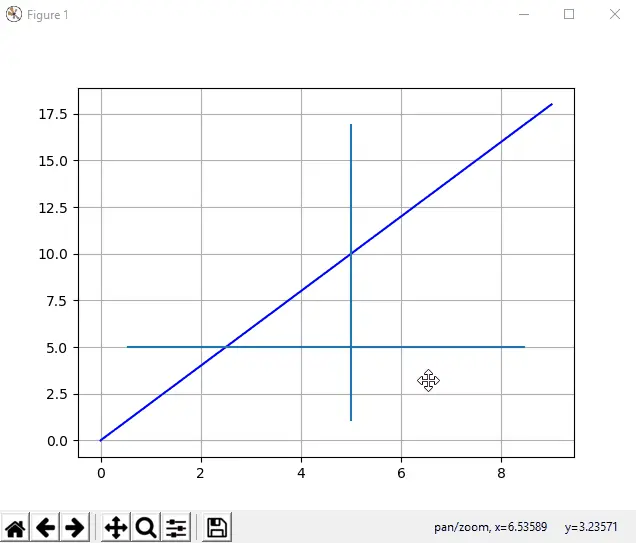
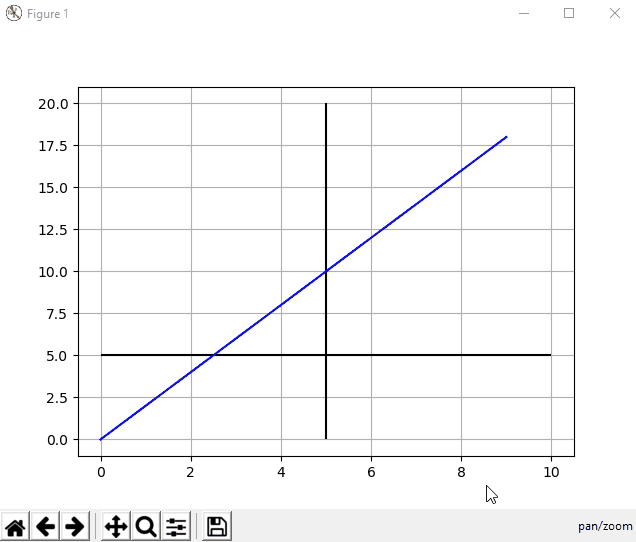
如上所述,xmin/ xmax 和 ymin/ ymax 是指 Matplot 圖,而不是所繪製的資料線。
因此,如果我們放大或縮小繪圖,則水平和垂直線的起點和終點將參考資料座標進行更新,但會固定在繪圖座標中的相對位置。我們可以用下面的動畫來更好的理解。
hlines 及 vlines 在 Matplotlib 中繪製水平和垂直線
如果我們希望繪製的水平線和垂直線會自動更改以保持對所繪資料的相對位置,則需要使用 hlines 和 vlines。
hlines(y, xmin, xmax)
這裡 y,xmin 和 xmax 指的是資料座標值。
vlines(x, ymin, ymax)
這裡 x,ymin 並 ymax 指的是資料座標值。
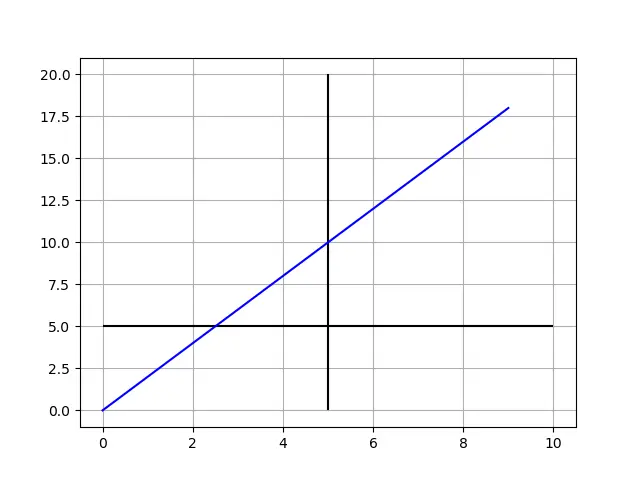
讓我們看下面的程式碼示例。
from matplotlib import pyplot as plt

xdata = list(range(10))
ydata = [_ * 2 for _ in xdata]

plt.plot(xdata, ydata, "b")

plt.hlines(y=5, xmin=0, xmax=10)
plt.vlines(x=5, ymin=0, ymax=20)

plt.grid()
plt.show()
在 Matplotlib 中繪製水平和垂直線的結論
如果你繪製的線段跟繪圖保持相對固定的位置,則 axhline 和 axvline 應該是更好的選擇。
如果你繪製的線段需要參照所繪資料,則 hlines 和 vlines 是更好的選擇。
Conclusion of drawing horizontal and vertical lines in Matplotlib
If you need the line to be referred to the plot, axhline and axvline should be the better option.
If you prefer the line to stick to the data coordinate, hlines and vlines are the better choices.
