如何在 Matplotlib 中绘制水平和垂直线
-
axhline及axvline在 Matplotlib 中绘制水平和垂直线 -
hlines及vlines在 Matplotlib 中绘制水平和垂直线 - 在 Matplotlib 中绘制水平和垂直线的结论
- Conclusion of drawing horizontal and vertical lines in Matplotlib
在本教程中,我们将介绍两种在 Matplotlib 中绘制水平和垂直线条的方法。这两种方法在 Matplotlib 中使用不同的坐标系统。
axhline()/axvline()hlines()/vlines()
axhline 及 axvline 在 Matplotlib 中绘制水平和垂直线
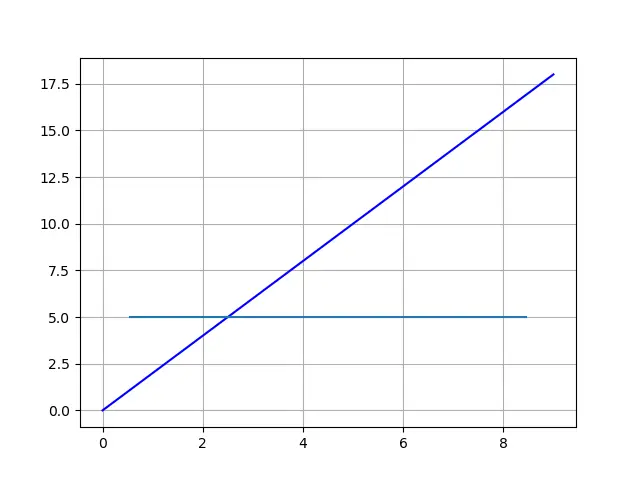
axhline 画一条水平线
matplotlib.pyplot.axhline(y=0, xmin=0, xmax=1, hold=None, **kwargs)
axhline 在水平线的 y 数据坐标中的位置处绘制一条水平线,从 xmin 到 xmax,该点应位于 0.0 和之间 1.0,其中 0.0 是图的最左侧,1.0 是图的最右侧。
from matplotlib import pyplot as plt

xdata = list(range(10))
ydata = [_ * 2 for _ in xdata]

plt.plot(xdata, ydata, "b")

plt.axhline(y=5, xmin=0.1, xmax=0.9)

plt.grid()
plt.show()
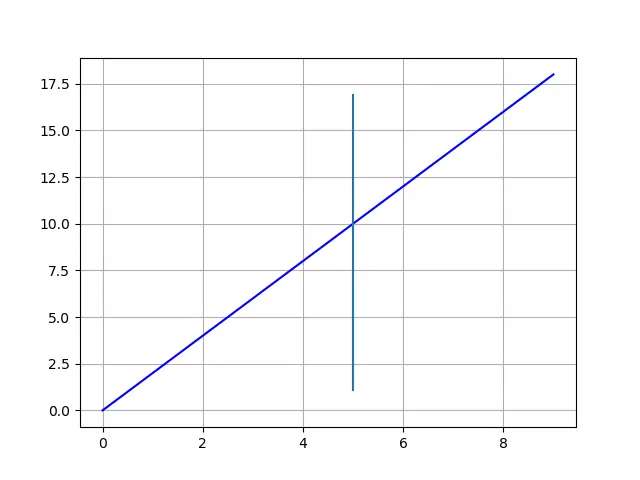
axvline 画一条垂直线
同样,
matplotlib.pyplot.axvline(x=0, ymin=0, ymax=1, hold=None, **kwargs)
axvline 在垂直线的 x 数据坐标中的位置处绘制一条垂直线,从 ymin 到 ymax,该点应在 0.0 和之间 1.0,其中 0.0 是图的底部,1.0 是图的顶部。
from matplotlib import pyplot as plt

xdata = list(range(10))
ydata = [_ * 2 for _ in xdata]

plt.plot(xdata, ydata, "b")

plt.axvline(x=5, ymin=0.1, ymax=0.9)

plt.grid()
plt.show()
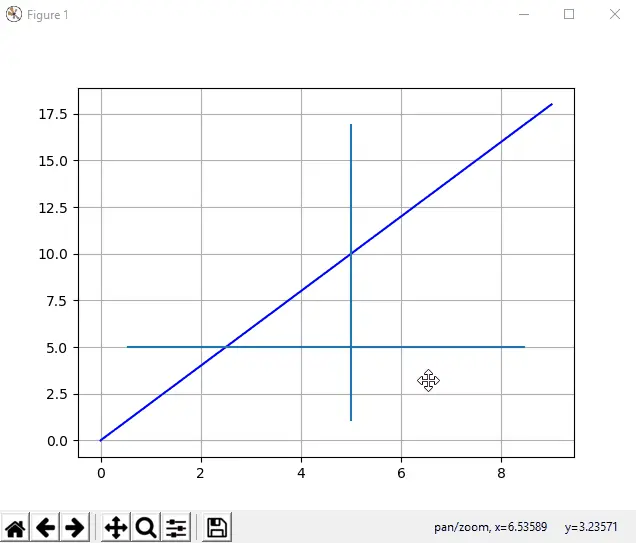
如上所述,xmin/ xmax 和 ymin/ ymax 是指 Matplot 图,而不是所绘制的数据线。
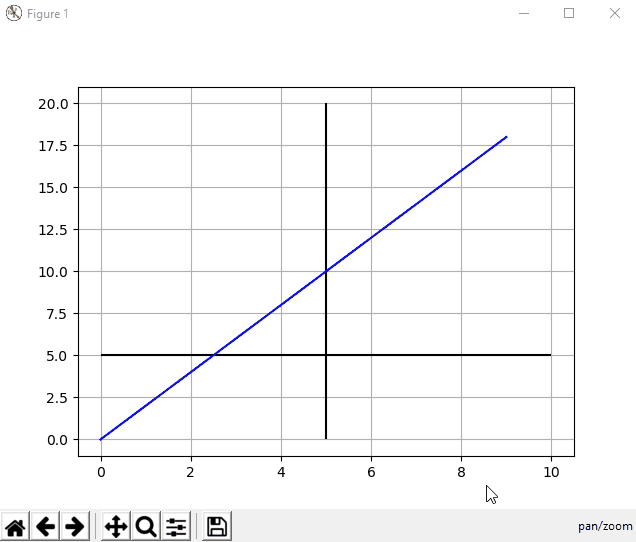
因此,如果我们放大或缩小绘图,则水平和垂直线的起点和终点将参考数据坐标进行更新,但会固定在绘图坐标中的相对位置。我们可以用下面的动画来更好的理解。
hlines 及 vlines 在 Matplotlib 中绘制水平和垂直线
如果我们希望绘制的水平线和垂直线会自动更改以保持对所绘数据的相对位置,则需要使用 hlines 和 vlines。
hlines(y, xmin, xmax)
这里 y,xmin 和 xmax 指的是数据坐标值。
vlines(x, ymin, ymax)
这里 x,ymin 并 ymax 指的是数据坐标值。
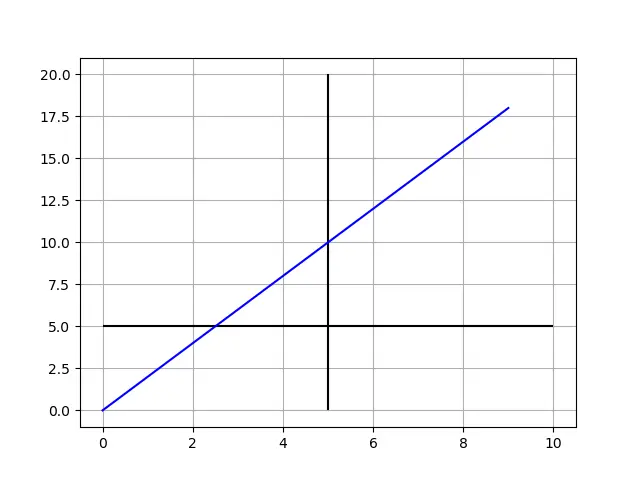
让我们看下面的代码示例。
from matplotlib import pyplot as plt

xdata = list(range(10))
ydata = [_ * 2 for _ in xdata]

plt.plot(xdata, ydata, "b")

plt.hlines(y=5, xmin=0, xmax=10)
plt.vlines(x=5, ymin=0, ymax=20)

plt.grid()
plt.show()
在 Matplotlib 中绘制水平和垂直线的结论
如果你绘制的线段跟绘图保持相对固定的位置,则 axhline 和 axvline 应该是更好的选择。
如果你绘制的线段需要参照所绘数据,则 hlines 和 vlines 是更好的选择。
Conclusion of drawing horizontal and vertical lines in Matplotlib
If you need the line to be referred to the plot, axhline and axvline should be the better option.
If you prefer the line to stick to the data coordinate, hlines and vlines are the better choices.
