在 Matplotlib 的图上画垂直线
Vaibhav Vaibhav
2024年2月15日
Matplotlib
Matplotlib Line
在处理图表时,我们经常需要在图表上绘制水平线和垂直线来描绘一些信息。它可以是某个平均值、某个阈值或某个范围。本文将讨论如何在 Python 中使用 Matplotlib 生成的图上创建垂直线。
在 Matplotlib 中使用 axvline() 绘制垂直线
axvline() 是来自 Matplotlib 库的一个函数,它沿着轴绘制垂直线。这个函数占用了很多参数,但我们将讨论其中的三个,如下所示。
x: The position of the line on thex-axisymin:该值应介于 0 和 1 之间,其中 0 表示图的底部,1 表示图的顶部。ymax:该值应介于 0 和 1 之间,其中 0 表示图的底部,1 表示图的顶部。
其他参数包括 color、label、marker、snap、transform、url、visible 等。
请参阅以下示例以了解如何使用这个函数。
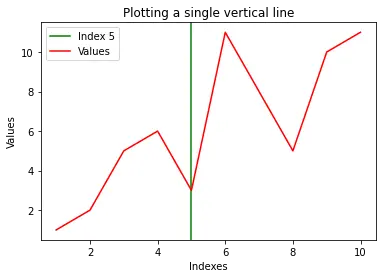
示例 1 - 绘制一条垂直线
import random
import numpy as np
import matplotlib.pyplot as plt

x = np.array([1, 2, 3, 4, 5, 6, 7, 8, 9, 10])
y = np.array([1, 2, 5, 6, 3, 11, 8, 5, 10, 11])
# Plotting a single vertical line
plt.axvline(x=5, color="green", label="Index 5")
plt.plot(x, y, color="red", label="Values")
plt.title("Plotting a single vertical line")
plt.xlabel("Indexes")
plt.ylabel("Values")
plt.legend()
plt.show()
输出:
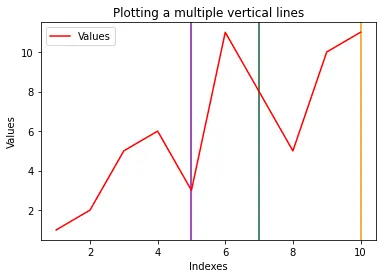
示例 2 - 绘制多条垂直线
import random
import numpy as np
import matplotlib.pyplot as plt

x = np.array([1, 2, 3, 4, 5, 6, 7, 8, 9, 10])
y = np.array([1, 2, 5, 6, 3, 11, 8, 5, 10, 11])

for i in range(3):
    plt.axvline(
        x=random.randint(1, 10),
        color=np.random.rand(
            3,
        ),
    )  # Plotting a vertical line

plt.plot(x, y, color="red", label="Values")
plt.title("Plotting multiple vertical lines")
plt.xlabel("Indexes")
plt.ylabel("Values")
plt.legend()
plt.show()
输出:
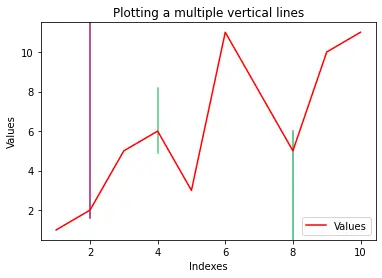
示例 3 - 具有可变长度的多条线
import random
import numpy as np
import matplotlib.pyplot as plt

x = np.array([1, 2, 3, 4, 5, 6, 7, 8, 9, 10])
y = np.array([1, 2, 5, 6, 3, 11, 8, 5, 10, 11])
yMins = [1, 0.7, 0.5]
yMaxs = [0.1, 0.4, 0]
positions = [2, 4, 8]

for i in range(3):
    plt.axvline(
        x=positions[i],
        ymin=yMins[i],
        ymax=yMaxs[i],
        color=np.random.rand(
            3,
        ),
    )  # Plotting a vertical line

plt.plot(x, y, color="red", label="Values")
plt.title("Plotting a multiple vertical lines")
plt.xlabel("Indexes")
plt.ylabel("Values")
plt.legend()
plt.show()
输出:
Enjoying our tutorials? Subscribe to DelftStack on YouTube to support us in creating more high-quality video guides. Subscribe
作者: Vaibhav Vaibhav

Vaibhav is an artificial intelligence and cloud computing stan. He likes to build end-to-end full-stack web and mobile applications. Besides computer science and technology, he loves playing cricket and badminton, going on bike rides, and doodling.