플롯 Matplotlib에 수직선 그리기
Vaibhav Vaibhav
2021년11월29일
Matplotlib
Matplotlib Line
그래프로 작업할 때 일부 정보를 나타내기 위해 그래프 위에 수평선과 수직선을 그려야 하는 경우가 많습니다. 평균값, 임계값 또는 범위일 수 있습니다. 이 기사에서는 Python에서 Matplotlib를 사용하여 생성된 플롯에 수직선을 만드는 방법에 대해 설명합니다.
Matplotlib에서 axvline()을 사용하여 수직선 그리기
axvline()은 축을 따라 수직선을 그리는 Matplotlib 라이브러리의 함수입니다. 이 함수는 많은 인수를 차지하지만 다음과 같이 나열된 세 가지 인수에 대해 설명합니다.
x: The position of the line on thex-axisymin: 이 값은 0과 1 사이여야 합니다. 여기서 0은 플롯의 하단을 나타내고 1은 플롯의 상단을 나타냅니다.ymax: 이 값은 0과 1 사이여야 합니다. 여기서 0은 플롯의 하단을 나타내고 1은 플롯의 상단을 나타냅니다.
다른 인수로는 color, label, marker, snap, transform, url, visible 등이 있습니다.
이 기능을 사용하는 방법을 이해하려면 다음 예를 참조하십시오.
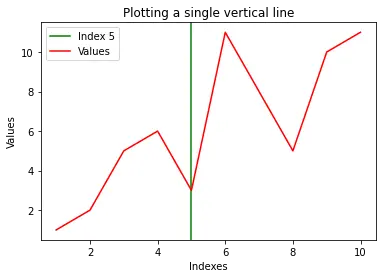
예 1 - 단일 수직선 플로팅
import random
import numpy as np
import matplotlib.pyplot as plt

x = np.array([1, 2, 3, 4, 5, 6, 7, 8, 9, 10])
y = np.array([1, 2, 5, 6, 3, 11, 8, 5, 10, 11])
# Plotting a single vertical line
plt.axvline(x=5, color="green", label="Index 5")
plt.plot(x, y, color="red", label="Values")
plt.title("Plotting a single vertical line")
plt.xlabel("Indexes")
plt.ylabel("Values")
plt.legend()
plt.show()
출력:
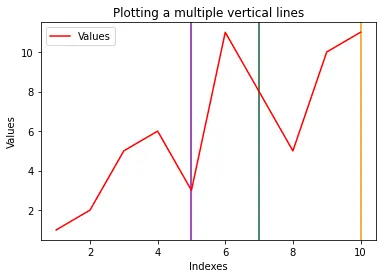
예 2 - 여러 수직선 플로팅
import random
import numpy as np
import matplotlib.pyplot as plt

x = np.array([1, 2, 3, 4, 5, 6, 7, 8, 9, 10])
y = np.array([1, 2, 5, 6, 3, 11, 8, 5, 10, 11])

for i in range(3):
    plt.axvline(
        x=random.randint(1, 10),
        color=np.random.rand(
            3,
        ),
    )  # Plotting a vertical line

plt.plot(x, y, color="red", label="Values")
plt.title("Plotting multiple vertical lines")
plt.xlabel("Indexes")
plt.ylabel("Values")
plt.legend()
plt.show()
출력:
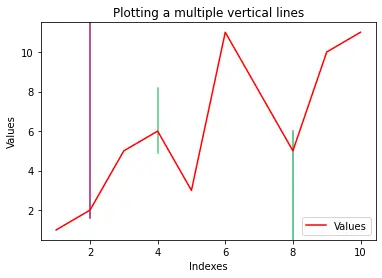
예 3 - 가변 길이의 여러 줄
import random
import numpy as np
import matplotlib.pyplot as plt

x = np.array([1, 2, 3, 4, 5, 6, 7, 8, 9, 10])
y = np.array([1, 2, 5, 6, 3, 11, 8, 5, 10, 11])
yMins = [1, 0.7, 0.5]
yMaxs = [0.1, 0.4, 0]
positions = [2, 4, 8]

for i in range(3):
    plt.axvline(
        x=positions[i],
        ymin=yMins[i],
        ymax=yMaxs[i],
        color=np.random.rand(
            3,
        ),
    )  # Plotting a vertical line

plt.plot(x, y, color="red", label="Values")
plt.title("Plotting a multiple vertical lines")
plt.xlabel("Indexes")
plt.ylabel("Values")
plt.legend()
plt.show()
출력:
튜토리얼이 마음에 드시나요? DelftStack을 구독하세요 YouTube에서 저희가 더 많은 고품질 비디오 가이드를 제작할 수 있도록 지원해주세요. 구독하다
작가: Vaibhav Vaibhav

Vaibhav is an artificial intelligence and cloud computing stan. He likes to build end-to-end full-stack web and mobile applications. Besides computer science and technology, he loves playing cricket and badminton, going on bike rides, and doodling.