Zeichnen vertikale Linien auf einem Plot Matplotlib
Bei der Arbeit mit Grafiken müssen wir oft horizontale und vertikale Linien über die Grafiken ziehen, um einige Informationen darzustellen. Es kann ein Durchschnittswert, ein Schwellenwert oder ein Bereich sein. In diesem Artikel wird beschrieben, wie wir vertikale Linien in Diagrammen erstellen können, die mit Matplotlib in Python generiert wurden.
Zeichnen Sie vertikale Linien mit axvline() in Matplotlib
axvline() ist eine Funktion aus der Matplotlib-Bibliothek, die vertikale Linien entlang der Achsen zeichnet. Diese Funktion nimmt viele Argumente auf, aber wir werden über drei davon sprechen, die im Folgenden aufgelistet sind.
x: The position of the line on thex-axisymin: Dieser Wert sollte zwischen 0 und 1 liegen, wobei 0 den unteren Rand des Plots und 1 den oberen Rand des Plots darstellt.ymax: Dieser Wert sollte zwischen 0 und 1 liegen, wobei 0 den unteren Rand des Plots und 1 den oberen Rand des Plots darstellt.
Andere Argumente sind color, label, marker, snap, transform, url, visible usw.
Sehen Sie sich die folgenden Beispiele an, um die Verwendung dieser Funktion zu verstehen.
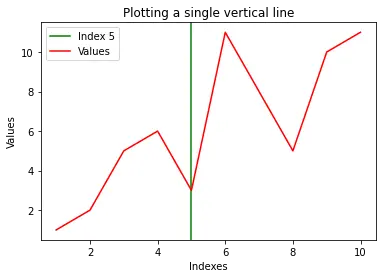
Beispiel 1 – Zeichnen einer einzelnen vertikalen Linie
import random
import numpy as np
import matplotlib.pyplot as plt

x = np.array([1, 2, 3, 4, 5, 6, 7, 8, 9, 10])
y = np.array([1, 2, 5, 6, 3, 11, 8, 5, 10, 11])
# Plotting a single vertical line
plt.axvline(x=5, color="green", label="Index 5")
plt.plot(x, y, color="red", label="Values")
plt.title("Plotting a single vertical line")
plt.xlabel("Indexes")
plt.ylabel("Values")
plt.legend()
plt.show()
Ausgabe:
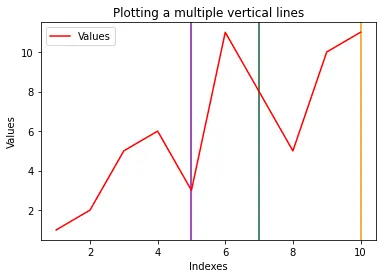
Beispiel 2 – Zeichnen mehrerer vertikaler Linien
import random
import numpy as np
import matplotlib.pyplot as plt

x = np.array([1, 2, 3, 4, 5, 6, 7, 8, 9, 10])
y = np.array([1, 2, 5, 6, 3, 11, 8, 5, 10, 11])

for i in range(3):
    plt.axvline(
        x=random.randint(1, 10),
        color=np.random.rand(
            3,
        ),
    )  # Plotting a vertical line

plt.plot(x, y, color="red", label="Values")
plt.title("Plotting multiple vertical lines")
plt.xlabel("Indexes")
plt.ylabel("Values")
plt.legend()
plt.show()
Ausgabe:
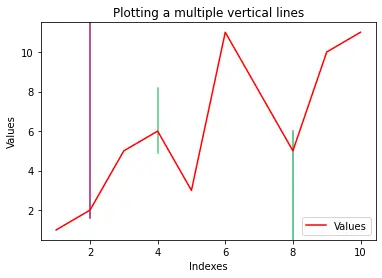
Beispiel 3 – Mehrere Zeilen mit variablen Längen
import random
import numpy as np
import matplotlib.pyplot as plt

x = np.array([1, 2, 3, 4, 5, 6, 7, 8, 9, 10])
y = np.array([1, 2, 5, 6, 3, 11, 8, 5, 10, 11])
yMins = [1, 0.7, 0.5]
yMaxs = [0.1, 0.4, 0]
positions = [2, 4, 8]

for i in range(3):
    plt.axvline(
        x=positions[i],
        ymin=yMins[i],
        ymax=yMaxs[i],
        color=np.random.rand(
            3,
        ),
    )  # Plotting a vertical line

plt.plot(x, y, color="red", label="Values")
plt.title("Plotting a multiple vertical lines")
plt.xlabel("Indexes")
plt.ylabel("Values")
plt.legend()
plt.show()
Ausgabe:

Vaibhav is an artificial intelligence and cloud computing stan. He likes to build end-to-end full-stack web and mobile applications. Besides computer science and technology, he loves playing cricket and badminton, going on bike rides, and doodling.