Tracer des lignes verticales sur un tracé Matplotlib
Lorsque nous travaillons avec des graphiques, nous devons souvent tracer des lignes horizontales et verticales sur les graphiques pour représenter certaines informations. Il peut s’agir d’une valeur moyenne, d’une valeur seuil ou d’une plage. Cet article expliquera comment créer des lignes verticales sur des tracés générés à l’aide de Matplotlib en Python.
Tracez des lignes verticales à l’aide de axvline() dans Matplotlib
axvline() est une fonction de la bibliothèque Matplotlib qui trace des lignes verticales le long des axes. Cette fonction prend de nombreux arguments, mais nous en parlerons trois qui sont répertoriés comme suit.
x: The position of the line on thex-axisymin: Cette valeur doit être comprise entre 0 et 1, où 0 représente le bas du tracé, et 1 représente le haut du tracé.ymax: Cette valeur doit être comprise entre 0 et 1, où 0 représente le bas du tracé, et 1 représente le haut du tracé.
D’autres arguments incluent color, label, marker, snap, transform, url, visible, etc.
Référez-vous aux exemples suivants pour comprendre comment utiliser cette fonction.
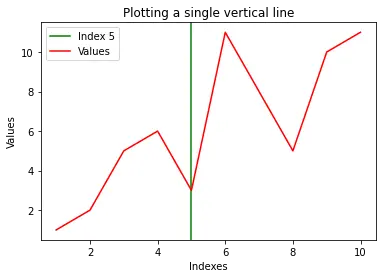
Exemple 1 - Tracer une seule ligne verticale
import random
import numpy as np
import matplotlib.pyplot as plt

x = np.array([1, 2, 3, 4, 5, 6, 7, 8, 9, 10])
y = np.array([1, 2, 5, 6, 3, 11, 8, 5, 10, 11])
# Plotting a single vertical line
plt.axvline(x=5, color="green", label="Index 5")
plt.plot(x, y, color="red", label="Values")
plt.title("Plotting a single vertical line")
plt.xlabel("Indexes")
plt.ylabel("Values")
plt.legend()
plt.show()
Production:
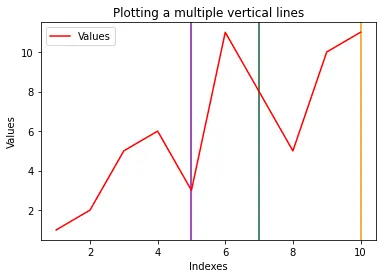
Exemple 2 - Tracer plusieurs lignes verticales
import random
import numpy as np
import matplotlib.pyplot as plt

x = np.array([1, 2, 3, 4, 5, 6, 7, 8, 9, 10])
y = np.array([1, 2, 5, 6, 3, 11, 8, 5, 10, 11])

for i in range(3):
    plt.axvline(
        x=random.randint(1, 10),
        color=np.random.rand(
            3,
        ),
    )  # Plotting a vertical line

plt.plot(x, y, color="red", label="Values")
plt.title("Plotting multiple vertical lines")
plt.xlabel("Indexes")
plt.ylabel("Values")
plt.legend()
plt.show()
Production:
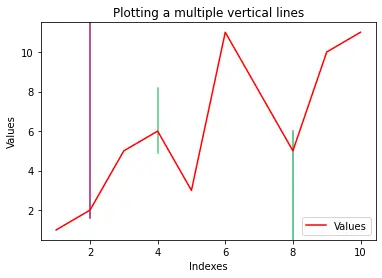
Exemple 3 - Plusieurs lignes avec des longueurs variables
import random
import numpy as np
import matplotlib.pyplot as plt

x = np.array([1, 2, 3, 4, 5, 6, 7, 8, 9, 10])
y = np.array([1, 2, 5, 6, 3, 11, 8, 5, 10, 11])
yMins = [1, 0.7, 0.5]
yMaxs = [0.1, 0.4, 0]
positions = [2, 4, 8]

for i in range(3):
    plt.axvline(
        x=positions[i],
        ymin=yMins[i],
        ymax=yMaxs[i],
        color=np.random.rand(
            3,
        ),
    )  # Plotting a vertical line

plt.plot(x, y, color="red", label="Values")
plt.title("Plotting a multiple vertical lines")
plt.xlabel("Indexes")
plt.ylabel("Values")
plt.legend()
plt.show()
Production:

Vaibhav is an artificial intelligence and cloud computing stan. He likes to build end-to-end full-stack web and mobile applications. Besides computer science and technology, he loves playing cricket and badminton, going on bike rides, and doodling.