How to Draw Vertical Lines on a Plot Matplotlib
When working with graphs, we often have to draw horizontal and vertical lines over the graphs to depict some information. It could be some average value, some threshold value, or some range.
This article will talk about how we can create vertical lines on plots generated using Matplotlib in Python.
Draw Vertical Lines Using axvline() in Matplotlib
axvline() is a function from the Matplotlib library that draws vertical lines along the axes. This function takes up many arguments, but we will talk about three of them which are listed as follows.
x: The position of the line on thex-axisymin: This value should be between 0 and 1, where 0 represents the bottom of the plot, and 1 represents the top of the plot.ymax: This value should be between 0 and 1, where 0 represents the bottom of the plot, and 1 represents the top of the plot.
Other arguments include color, label, marker, snap, transform, url, visible, etc.
Refer to the following examples to understand how to use this function.
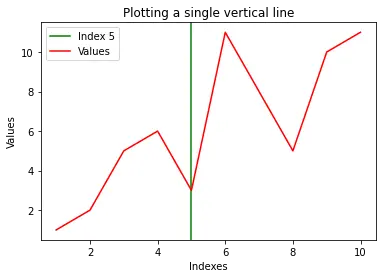
Example 1 - Plotting a Single Vertical Line
import random
import numpy as np
import matplotlib.pyplot as plt

x = np.array([1, 2, 3, 4, 5, 6, 7, 8, 9, 10])
y = np.array([1, 2, 5, 6, 3, 11, 8, 5, 10, 11])
# Plotting a single vertical line
plt.axvline(x=5, color="green", label="Index 5")
plt.plot(x, y, color="red", label="Values")
plt.title("Plotting a single vertical line")
plt.xlabel("Indexes")
plt.ylabel("Values")
plt.legend()
plt.show()
Output:
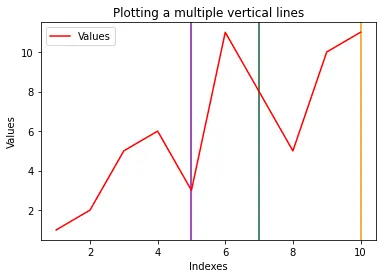
Example 2 - Plotting Multiple Vertical Lines
import random
import numpy as np
import matplotlib.pyplot as plt

x = np.array([1, 2, 3, 4, 5, 6, 7, 8, 9, 10])
y = np.array([1, 2, 5, 6, 3, 11, 8, 5, 10, 11])

for i in range(3):
    plt.axvline(
        x=random.randint(1, 10),
        color=np.random.rand(
            3,
        ),
    )  # Plotting a vertical line

plt.plot(x, y, color="red", label="Values")
plt.title("Plotting multiple vertical lines")
plt.xlabel("Indexes")
plt.ylabel("Values")
plt.legend()
plt.show()
Output:
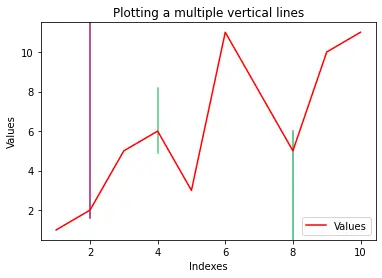
Example 3 - Multiple Lines With Variable Lengths
import random
import numpy as np
import matplotlib.pyplot as plt

x = np.array([1, 2, 3, 4, 5, 6, 7, 8, 9, 10])
y = np.array([1, 2, 5, 6, 3, 11, 8, 5, 10, 11])
yMins = [1, 0.7, 0.5]
yMaxs = [0.1, 0.4, 0]
positions = [2, 4, 8]

for i in range(3):
    plt.axvline(
        x=positions[i],
        ymin=yMins[i],
        ymax=yMaxs[i],
        color=np.random.rand(
            3,
        ),
    )  # Plotting a vertical line

plt.plot(x, y, color="red", label="Values")
plt.title("Plotting a multiple vertical lines")
plt.xlabel("Indexes")
plt.ylabel("Values")
plt.legend()
plt.show()
Output:

Vaibhav is an artificial intelligence and cloud computing stan. He likes to build end-to-end full-stack web and mobile applications. Besides computer science and technology, he loves playing cricket and badminton, going on bike rides, and doodling.