How to Plot Horizontal and Vertical Line in Matplotlib
-
axhlineandaxvlineto Plot Horizontal and Vertical Lines in Matplotlib -
hlinesandvlinesto Plot Horizontal and Vertical Line in Matplotlib - Conclusion of Drawing Horizontal and Vertical Lines in Matplotlib
In this tutorial, we will introduce two methods to draw horizontal and vertical lines in Matplotlib. These two methods use different coordinates in Matplotlib.
axhline()/axvline()hlines()/vlines()
axhline and axvline to Plot Horizontal and Vertical Lines in Matplotlib
axhline to Plot a Horizontal Line
matplotlib.pyplot.axhline(y=0, xmin=0, xmax=1, hold=None, **kwargs)
axhline plots a horizontal line at the position of y in data coordinate of the horizontal line, starting from xmin to xmax that should be between 0.0 and 1.0, where 0.0 is the far left of the plot and 1.0 is the far right of the plot.
from matplotlib import pyplot as plt
xdata = list(range(10))
ydata = [_ * 2 for _ in xdata]
plt.plot(xdata, ydata, "b")
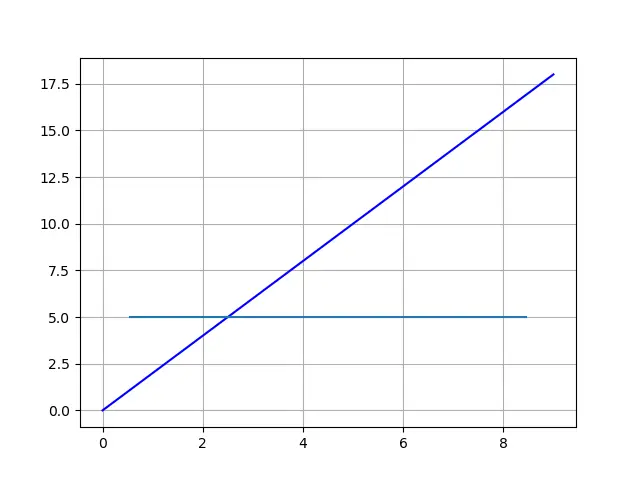
plt.axhline(y=5, xmin=0.1, xmax=0.9)
plt.grid()
plt.show()
axvline to Plot a Vertical Line
Similarly,
matplotlib.pyplot.axvline(x=0, ymin=0, ymax=1, hold=None, **kwargs)
axvline plots a vertical line at the position of x in data coordinate of the vertical line, starting from ymin to ymax that should be between 0.0 and 1.0, where 0.0 is the bottom of the plot and 1.0 is the top of the plot.
from matplotlib import pyplot as plt
xdata = list(range(10))
ydata = [_ * 2 for _ in xdata]
plt.plot(xdata, ydata, "b")
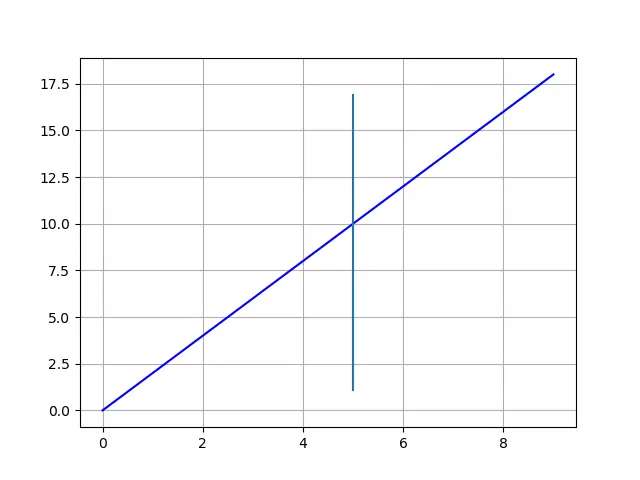
plt.axvline(x=5, ymin=0.1, ymax=0.9)
plt.grid()
plt.show()
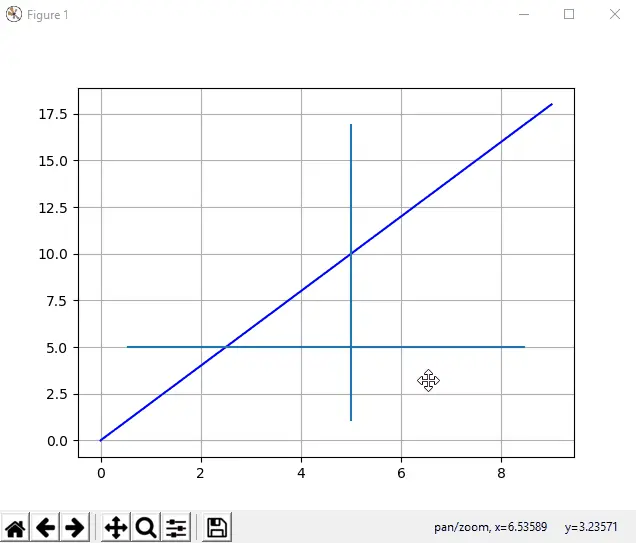
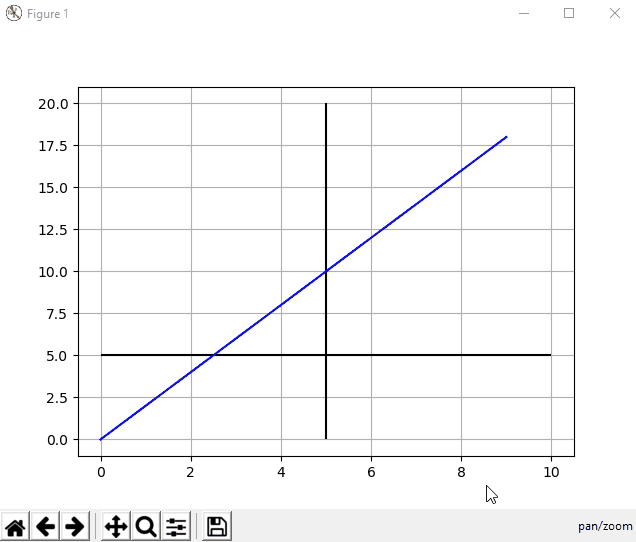
As stated above, xmin / xmax and ymin / ymax are referred to the plot, but not to the data lines.
Therefore, if we zoom in or out the plot, the starting and ending points of the horizontal and vertical lines will be updated with the reference to the data coordinate, but stick to the relative positions in the plot coordinate. We could check the below animation to have better a understanding.
hlines and vlines to Plot Horizontal and Vertical Line in Matplotlib
If we want the plotted horizontal and vertical lines will change automatically to keep the relative position to the data coordinate, we need to use hlines and vlines to plot lines.
hlines(y, xmin, xmax)
Here, y, xmin and xmax are the values of the data coordinate.
vlines(x, ymin, ymax)
Here, x, ymin and ymax are the values of the data coordinate.
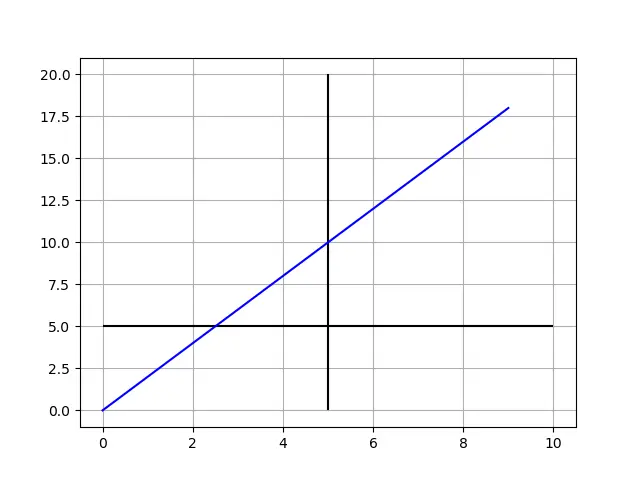
Let’s see the example codes below.
from matplotlib import pyplot as plt

xdata = list(range(10))
ydata = [_ * 2 for _ in xdata]

plt.plot(xdata, ydata, "b")

plt.hlines(y=5, xmin=0, xmax=10)
plt.vlines(x=5, ymin=0, ymax=20)

plt.grid()
plt.show()
Conclusion of Drawing Horizontal and Vertical Lines in Matplotlib
If you need the line to be referred to the plot, axhline and axvline should be the better option.
If you prefer the line to stick to the data coordinate, hlines and vlines are the better choices.

Founder of DelftStack.com. Jinku has worked in the robotics and automotive industries for over 8 years. He sharpened his coding skills when he needed to do the automatic testing, data collection from remote servers and report creation from the endurance test. He is from an electrical/electronics engineering background but has expanded his interest to embedded electronics, embedded programming and front-/back-end programming.
LinkedIn Facebook