How to Plot Multiple Lines in Python Matplotlib

This tutorial explains how we can plot multiple lines using Matplotlib and set a different color for each line in the figure.
Plot a Single Line in Python Matplotlib
import numpy as np
import matplotlib.pyplot as plt

x = np.arange(8)
y = 4 * x - 10

plt.plot(x, y)
plt.title("Plot line in Matplotlib", fontsize=15)
plt.xlabel("X", fontsize=13)
plt.ylabel("Y", fontsize=13)
plt.show()
Output:

It creates a plot of the line using the matplotlib.pyplot.plot() function. We pass the X and Y coordinates of the line as arguments to the plot() function.
Plot Multiple Lines in Python Matplotlib
To plot multiple lines in Matplotlib, we keep on calling the matplotlib.pyplot.plot() function for each line and pass the line’s coordinates as an argument to the respective plot() function.
import numpy as np
import matplotlib.pyplot as plt

x = np.arange(8)
y1 = 4 * x + 5
y2 = 3 * x + 5
y3 = 2 * x + 5
y4 = x + 5

plt.plot(x, y1)
plt.plot(x, y2)
plt.plot(x, y3)
plt.plot(x, y4)

plt.title("Plot Multiple lines in Matplotlib", fontsize=15)
plt.xlabel("X", fontsize=13)
plt.ylabel("Y", fontsize=13)
plt.show()
Output:

It plots four different lines with common axes, each with different colors. We call the matplotlib.pyplot.plot() function 4 times to plot the 4 different lines. Every time we pass the coordinates of different lines as arguments to the function.
To make the plot more descriptive, we can add the legend to the plot to infer which line is represented by which color.
import numpy as np
import matplotlib.pyplot as plt

x = np.arange(8)
y1 = 4 * x + 5
y2 = 3 * x + 5
y3 = 2 * x + 5
y4 = x + 5

plt.plot(x, y1, label="4x+5")
plt.plot(x, y2, label="3x+5")
plt.plot(x, y3, label="2x+5")
plt.plot(x, y4, label="x+5")

plt.title("Plot Multiple lines in Matplotlib", fontsize=15)
plt.xlabel("X", fontsize=13)
plt.ylabel("Y", fontsize=13)
plt.legend()
plt.show()
Output:
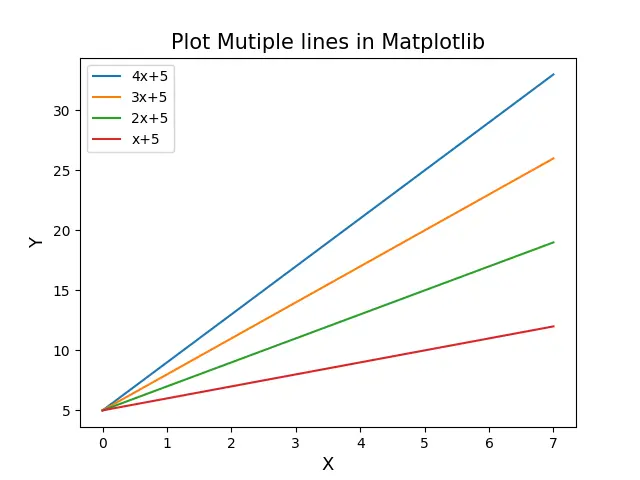
It plots 4 lines in the figure along with the legend. To add a legend to the figure, we set a label for each line while plotting the line by setting the label parameter in the plot() function. Finally, we call matplotlib.pyplot.legend() to add the figure’s legend.
By default, Matplotlib will assign the color to the line automatically. If we want to control the colors for each line, we use the matplotlib.axes.Axes.set_prop_cycle() method.
import numpy as np
import matplotlib.pyplot as plt

x = np.arange(8)
y1 = 4 * x + 5
y2 = 3 * x + 5
y3 = 2 * x + 5
y4 = x + 5

colors = ["orange", "purple", "green", "red"]

plt.gca().set_prop_cycle(color=colors)
plt.plot(x, y1, label="4x+5")
plt.plot(x, y2, label="3x+5")
plt.plot(x, y3, label="2x+5")
plt.plot(x, y4, label="x+5")

plt.title("Plot Multiple lines in Matplotlib", fontsize=15)
plt.xlabel("X", fontsize=13)
plt.ylabel("Y", fontsize=13)
plt.legend()
plt.show()
Output:

It sets the orange for the first line, purple for the second line, green for the third line, and red for the fourth line. We pass the list of colors to be used in order as an argument to the matplotlib.axes.Axes.set_prop_cycle() method.

Suraj Joshi is a backend software engineer at Matrice.ai.
LinkedIn