Linestyles in Matplotlib Python
This tutorial focuses on how we can use different line styles in the Matplotlib plot by setting the appropriate value of the linestyle parameter in the matplotlib.pyplot.plot() method. We have a lot of linestyle options available.
Set Line Styles in Matplotlib Python
import math
import numpy as np
import matplotlib.pyplot as plt

x = np.linspace(0, 2 * math.pi, 100)
y = np.sin(x)

plt.plot(x, y)
plt.xlabel("x")
plt.ylabel("sinx")
plt.title("Sinx Function")
plt.show()
Output:
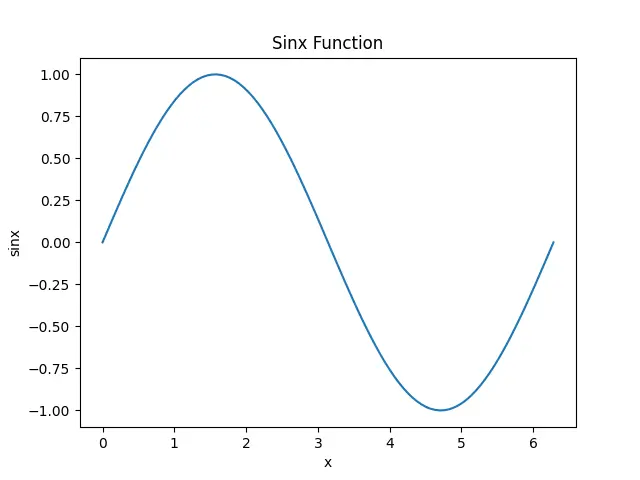
It generates the plot of the sinx function with the default line style as solid.
To see the choices available for the linestyle parameter, we can execute the following script:
from matplotlib import lines

print(lines.lineStyles.keys())
Output:
dict_keys(['-', '--', '-.', ':', 'None', ' ', ''])
We can use any of the output values to change the line style of the plot.
import math
import numpy as np
import matplotlib.pyplot as plt

x = np.linspace(0, 2 * math.pi, 100)
y = np.sin(x)

plt.plot(x, y, linestyle="-.")
plt.xlabel("x")
plt.ylabel("sinx")
plt.title("Sinx Function")
plt.show()
Output:
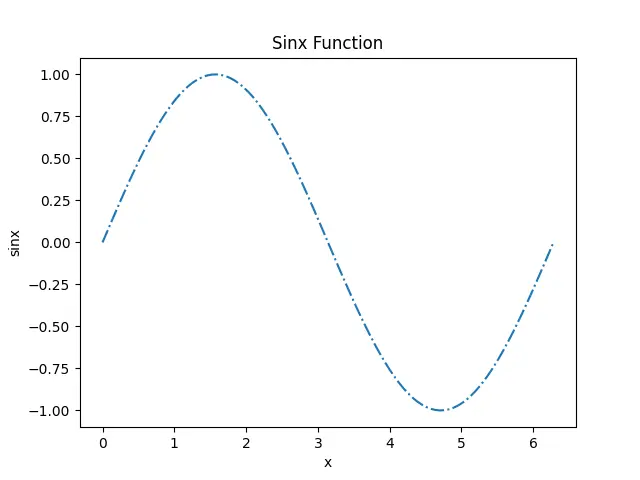
It sets the line style in our plot to -..
The Matplotlib Linestyle documentation provides us a dictionary which we can use to have more refined control over line styles. According to the documentation, we can set the line style with (offset, (on_off_seq)) tuple.
import math
import numpy as np
import matplotlib.pyplot as plt

from collections import OrderedDict

linestyles_dict = OrderedDict(
    [
        ("solid", (0, ())),
        ("loosely dotted", (0, (1, 10))),
        ("dotted", (0, (1, 5))),
        ("densely dotted", (0, (1, 1))),
        ("loosely dashed", (0, (5, 10))),
        ("dashed", (0, (5, 5))),
        ("densely dashed", (0, (5, 1))),
        ("loosely dashdotted", (0, (3, 10, 1, 10))),
        ("dashdotted", (0, (3, 5, 1, 5))),
        ("densely dashdotted", (0, (3, 1, 1, 1))),
        ("loosely dashdotdotted", (0, (3, 10, 1, 10, 1, 10))),
        ("dashdotdotted", (0, (3, 5, 1, 5, 1, 5))),
        ("densely dashdotdotted", (0, (3, 1, 1, 1, 1, 1))),
    ]
)

x = np.linspace(0, 2 * math.pi, 100)
y = np.sin(x)

plt.plot(x, y, linestyle=linestyles_dict["loosely dashdotdotted"])
plt.xlabel("x")
plt.ylabel("sinx")
plt.title("Sinx Function")
plt.show()
Output:
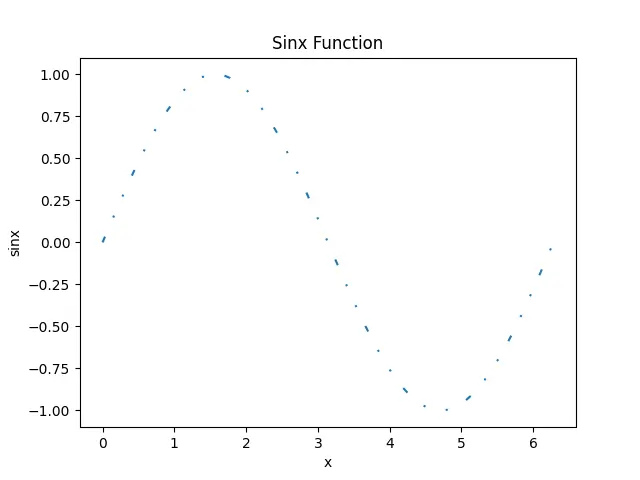
It sets the linestyle using the linestyles_dict dictionary. We can select any key that we want to set the line style to and pass the value of that key for the linestyles_dict dictionary as a linestyle parameter in the plot() method.

Suraj Joshi is a backend software engineer at Matrice.ai.
LinkedIn