Matplotlib 中 cla()、clf()和 close()方法之間的區別

matplotlib.pyplot.cla() 方法清除當前座標軸,matplotlib.pyplot.clf() 方法清除當前圖形,matplotlib.pyplot.close() 方法關閉整個視窗。
import math
import numpy as np
import matplotlib.pyplot as plt

x = np.linspace(0, 2 * math.pi, 100)
y1 = np.sin(x)
y2 = np.cos(x)

fig, ax = plt.subplots(2, 1)
ax[0].plot(x, y1)
ax[0].set_xlabel("x")
ax[0].set_ylabel("sinx")
ax[0].set_title("Plot of sinx")

ax[1].plot(x, y2)
ax[1].set_xlabel("x")
ax[1].set_ylabel("cosx")
ax[1].set_title("Plot of cosx")

fig.suptitle("Plot of sinx and cosx", fontsize=16)
fig.tight_layout(pad=3.0)

plt.show()
輸出:
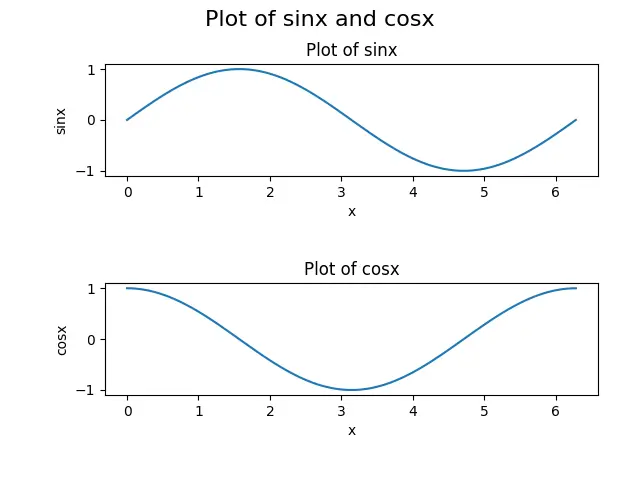
我們將用這個圖來解釋以下函式:cla()、clf() 和 close()。該圖由一個圖和兩個子圖組成,上排的子圖是 sinx 函式的圖,下排的子圖表示 cosx 函式的圖。
matplotlib.pyplot.cla()
matplotlib.pyplot.cla() 命令用於清除 Matplotlib 中的當前座標軸。Axes 只是一個圖的一部分,通常是一個子圖及其細節。
例如:matplotlib.pyplot.cla()
import math
import numpy as np
import matplotlib.pyplot as plt

x = np.linspace(0, 2 * math.pi, 100)
y1 = np.sin(x)
y2 = np.cos(x)

fig, ax = plt.subplots(2, 1)
ax[0].plot(x, y1)
ax[0].set_xlabel("x")
ax[0].set_ylabel("sinx")
ax[0].set_title("Plot of sinx")

ax[1].plot(x, y2)
ax[1].set_xlabel("x")
ax[1].set_ylabel("cosx")
ax[1].set_title("Plot of cosx")
ax[1].cla()

fig.suptitle("Plot of sinx and cosx", fontsize=16)
fig.tight_layout(pad=3.0)

plt.show()
輸出:
-example-in-Matplotlib-Python.webp)
在這裡,我們可以看到,cla() 方法清除了 ax[1] 軸,即子圖的第二行。清除軸意味著刪除子圖及其細節,如 xlabel、ylabel 和 title;但是,軸 ax[0] 或頂部的子圖沒有被該方法改變,因為 cla() 只被 ax[1] 軸呼叫。
matplotlib.pyplot.cla()
matplotlib.pyplot.clf() 可以清除 Matplotlib 中的整個圖。圖形可以看作是一個畫圖的超集,由畫圖中的每一個細節組成,如子圖、子軸、標題和圖例。
例:matplotlib.pyplot.clf()
import math
import numpy as np
import matplotlib.pyplot as plt

x = np.linspace(0, 2 * math.pi, 100)
y1 = np.sin(x)
y2 = np.cos(x)

fig, ax = plt.subplots(2, 1)
ax[0].plot(x, y1)
ax[0].set_xlabel("x")
ax[0].set_ylabel("sinx")
ax[0].set_title("Plot of sinx")


ax[1].plot(x, y2)
ax[1].set_xlabel("x")
ax[1].set_ylabel("cosx")
ax[1].set_title("Plot of cosx")

fig.suptitle("Plot of sinx and cosx", fontsize=16)
fig.tight_layout(pad=3.0)

plt.clf()
plt.show()
輸出:
-example-in-Matplotlib-Python.webp)
在這裡,我們可以看到 clf() 方法清除了繪圖中的所有內容。這個過程包括了所有的座標軸;但是,繪圖視窗仍然存在,它可以被重新使用來生成其他的圖形。
請注意,我們不能對每個軸使用 clf() 方法。
matplotlib.pyplot.close()
matplotlib.pyplot.close() 只是關閉了 Matplotlib 中的圖視窗,我們在呼叫 plt.show() 方法時不會看到任何東西。
例:matplotlib.pyplot.close()
import math
import numpy as np
import matplotlib.pyplot as plt

x = np.linspace(0, 2 * math.pi, 100)
y1 = np.sin(x)
y2 = np.cos(x)

fig, ax = plt.subplots(2, 1)
ax[0].plot(x, y1)
ax[0].set_xlabel("x")
ax[0].set_ylabel("sinx")
ax[0].set_title("Plot of sinx")


ax[1].plot(x, y2)
ax[1].set_xlabel("x")
ax[1].set_ylabel("cosx")
ax[1].set_title("Plot of cosx")

fig.suptitle("Plot of sinx and cosx", fontsize=16)
fig.tight_layout(pad=3.0)

plt.close()
plt.show()
指令碼不會產生任何輸出,因為 close() 方法會清除圖形並關閉視窗;我們使用 plt.show() 過程不會看到任何東西。

Suraj Joshi is a backend software engineer at Matrice.ai.
LinkedIn