Differences Between cla(), clf() and close() Methods in Matplotlib

The matplotlib.pyplot.cla() method clears the current axes, the matplotlib.pyplot.clf() method clears the current figure, and the matplotlib.pyplot.close() method closes the entire window.
import math
import numpy as np
import matplotlib.pyplot as plt

x = np.linspace(0, 2 * math.pi, 100)
y1 = np.sin(x)
y2 = np.cos(x)

fig, ax = plt.subplots(2, 1)
ax[0].plot(x, y1)
ax[0].set_xlabel("x")
ax[0].set_ylabel("sinx")
ax[0].set_title("Plot of sinx")

ax[1].plot(x, y2)
ax[1].set_xlabel("x")
ax[1].set_ylabel("cosx")
ax[1].set_title("Plot of cosx")

fig.suptitle("Plot of sinx and cosx", fontsize=16)
fig.tight_layout(pad=3.0)

plt.show()
Output:
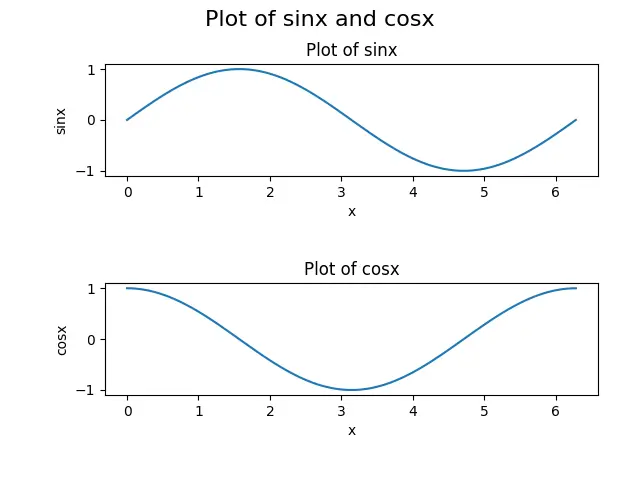
We will be using this figure to explain these functions: cla(), clf() and close(). The figure consists of a figure with two subplots; the subplot on the top row is the plot of the sinx function, while the subplot on the bottom row represents the plot of the cosx function.
matplotlib.pyplot.cla()
The matplotlib.pyplot.cla() command is used to clear the current axes in Matplotlib. Axes is simply a part of a figure, usually a subplot and its details.
Example:matplotlib.pyplot.cla()
import math
import numpy as np
import matplotlib.pyplot as plt

x = np.linspace(0, 2 * math.pi, 100)
y1 = np.sin(x)
y2 = np.cos(x)

fig, ax = plt.subplots(2, 1)
ax[0].plot(x, y1)
ax[0].set_xlabel("x")
ax[0].set_ylabel("sinx")
ax[0].set_title("Plot of sinx")

ax[1].plot(x, y2)
ax[1].set_xlabel("x")
ax[1].set_ylabel("cosx")
ax[1].set_title("Plot of cosx")
ax[1].cla()

fig.suptitle("Plot of sinx and cosx", fontsize=16)
fig.tight_layout(pad=3.0)

plt.show()
Output:
-example-in-Matplotlib-Python.webp)
Here, we can see that the cla() method clears the ax[1] axes, i.e. the second row of the subplot. Clearing axes means removing the subplot with its details, such as the xlabel, ylabel, and title; however, the axes ax[0] or the subplot in the top row is unaltered by the method because cla() was invoked only by the ax[1] axes.
matplotlib.pyplot.cla()
The matplotlib.pyplot.clf() clears the entire figure in Matplotlib. A figure can be considered the big picture of a plot, consisting of every detail in the plot like subplots, sub axis, titles, and legends.
Example:matplotlib.pyplot.clf()
import math
import numpy as np
import matplotlib.pyplot as plt

x = np.linspace(0, 2 * math.pi, 100)
y1 = np.sin(x)
y2 = np.cos(x)

fig, ax = plt.subplots(2, 1)
ax[0].plot(x, y1)
ax[0].set_xlabel("x")
ax[0].set_ylabel("sinx")
ax[0].set_title("Plot of sinx")


ax[1].plot(x, y2)
ax[1].set_xlabel("x")
ax[1].set_ylabel("cosx")
ax[1].set_title("Plot of cosx")

fig.suptitle("Plot of sinx and cosx", fontsize=16)
fig.tight_layout(pad=3.0)

plt.clf()
plt.show()
Output:
-example-in-Matplotlib-Python.webp)
Here, we can see that the clf() method clears everything in the plot. This process includes all the axes; however, the plot window is still there, which can be reused to generate other figures.
Keep in mind that we cannot use the clf() method for each axis.
matplotlib.pyplot.close()
The matplotlib.pyplot.close() simply closes the figure window in Matplotlib, and we won’t see anything when calling the plt.show() method.
Example:matplotlib.pyplot.close()
import math
import numpy as np
import matplotlib.pyplot as plt

x = np.linspace(0, 2 * math.pi, 100)
y1 = np.sin(x)
y2 = np.cos(x)

fig, ax = plt.subplots(2, 1)
ax[0].plot(x, y1)
ax[0].set_xlabel("x")
ax[0].set_ylabel("sinx")
ax[0].set_title("Plot of sinx")


ax[1].plot(x, y2)
ax[1].set_xlabel("x")
ax[1].set_ylabel("cosx")
ax[1].set_title("Plot of cosx")

fig.suptitle("Plot of sinx and cosx", fontsize=16)
fig.tight_layout(pad=3.0)

plt.close()
plt.show()
The script doesn’t generate any output as the close() method clears the figure and closes the window; we won’t see anything using the plt.show() process.

Suraj Joshi is a backend software engineer at Matrice.ai.
LinkedIn