Unterschiede zwischen den Methoden cla(), clf() und close() in Matplotlib

Die Methode matplotlib.pyplot.cla() löscht die aktuellen Achsen, die Methode matplotlib.pyplot.clf() löscht die aktuelle Abbildung, und die Methode matplotlib.pyplot.close() schließt das gesamte Fenster.
import math
import numpy as np
import matplotlib.pyplot as plt

x = np.linspace(0, 2 * math.pi, 100)
y1 = np.sin(x)
y2 = np.cos(x)

fig, ax = plt.subplots(2, 1)
ax[0].plot(x, y1)
ax[0].set_xlabel("x")
ax[0].set_ylabel("sinx")
ax[0].set_title("Plot of sinx")

ax[1].plot(x, y2)
ax[1].set_xlabel("x")
ax[1].set_ylabel("cosx")
ax[1].set_title("Plot of cosx")

fig.suptitle("Plot of sinx and cosx", fontsize=16)
fig.tight_layout(pad=3.0)

plt.show()
Ausgabe:
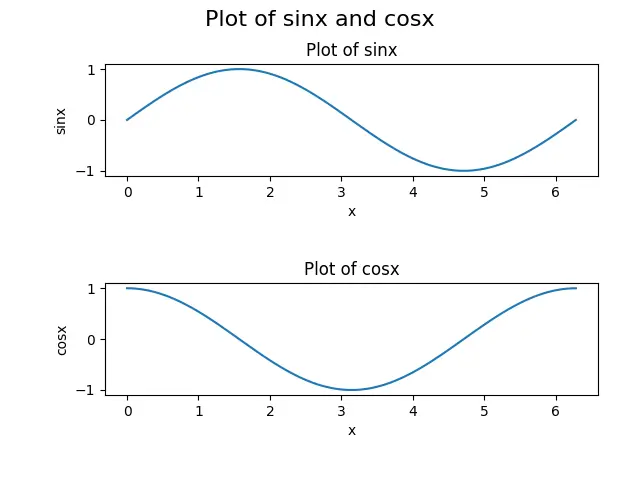
Wir werden diese Funktionen anhand dieser Abbildung erklären: cla(), clf() und close(). Die Abbildung besteht aus einer Abbildung mit zwei Unterdarstellungen; die Unterdarstellung in der oberen Reihe ist die Darstellung der sinx-Funktion, während die Unterdarstellung in der unteren Reihe die Darstellung der cosx-Funktion darstellt.
matplotlib.pyplot.cla()
Der Befehl matplotlib.pyplot.cla() wird verwendet, um die aktuellen Achsen in der Matplotlib zu löschen. Axes ist einfach ein Teil einer Figur, normalerweise ein Unterplot und seine Details.
Beispiel: matplotlib.pyplot.cla()
import math
import numpy as np
import matplotlib.pyplot as plt

x = np.linspace(0, 2 * math.pi, 100)
y1 = np.sin(x)
y2 = np.cos(x)

fig, ax = plt.subplots(2, 1)
ax[0].plot(x, y1)
ax[0].set_xlabel("x")
ax[0].set_ylabel("sinx")
ax[0].set_title("Plot of sinx")

ax[1].plot(x, y2)
ax[1].set_xlabel("x")
ax[1].set_ylabel("cosx")
ax[1].set_title("Plot of cosx")
ax[1].cla()

fig.suptitle("Plot of sinx and cosx", fontsize=16)
fig.tight_layout(pad=3.0)

plt.show()
Ausgabe:
-example-in-Matplotlib-Python.webp)
Hier können wir sehen, dass die cla() Methode die ax[1] Achsen, d.h. die zweite Reihe der Nebenhandlung, löscht. Achsen löschen bedeutet, daß die Nebenhandlung mit ihren Details, wie z. B. dem xlabel, dem ylabel und dem title, entfernt wird; die Achsen ax[0] oder die Nebenhandlung in der obersten Reihe werden jedoch durch die Methode nicht verändert, da cla() nur durch die ax[1] Achsen aufgerufen wurde.
matplotlib.pyplot.cla()
Die matplotlib.pyplot.clf() löscht die gesamte Figur in der Matplotlib. Eine Figur kann als das große Bild eines Plots betrachtet werden, das aus jedem Detail des Plots besteht, wie z. B. Unterplots, Unterachse, Titel und Legenden.
Beispiel:matplotlib.pyplot.clf()
import math
import numpy as np
import matplotlib.pyplot as plt

x = np.linspace(0, 2 * math.pi, 100)
y1 = np.sin(x)
y2 = np.cos(x)

fig, ax = plt.subplots(2, 1)
ax[0].plot(x, y1)
ax[0].set_xlabel("x")
ax[0].set_ylabel("sinx")
ax[0].set_title("Plot of sinx")


ax[1].plot(x, y2)
ax[1].set_xlabel("x")
ax[1].set_ylabel("cosx")
ax[1].set_title("Plot of cosx")

fig.suptitle("Plot of sinx and cosx", fontsize=16)
fig.tight_layout(pad=3.0)

plt.clf()
plt.show()
Ausstoß:
-example-in-Matplotlib-Python.webp)
Hier können wir sehen, dass die clf() Methode alles in der Handlung löscht. Dieser Prozess schließt alle Achsen ein; das Plotfenster ist jedoch immer noch vorhanden, das zur Erzeugung anderer Figuren wiederverwendet werden kann.
Denken Sie daran, dass wir die clf() Methode nicht für jede Achse verwenden können.
matplotlib.pyplot.close()
Die matplotlib.pyplot.close() schliesst einfach das Figurenfenster in der Matplotlib, und wir werden nichts sehen, wenn wir die plt.show() Methode aufrufen.
Beispiel:matplotlib.pyplot.close()
import math
import numpy as np
import matplotlib.pyplot as plt

x = np.linspace(0, 2 * math.pi, 100)
y1 = np.sin(x)
y2 = np.cos(x)

fig, ax = plt.subplots(2, 1)
ax[0].plot(x, y1)
ax[0].set_xlabel("x")
ax[0].set_ylabel("sinx")
ax[0].set_title("Plot of sinx")


ax[1].plot(x, y2)
ax[1].set_xlabel("x")
ax[1].set_ylabel("cosx")
ax[1].set_title("Plot of cosx")

fig.suptitle("Plot of sinx and cosx", fontsize=16)
fig.tight_layout(pad=3.0)

plt.close()
plt.show()
Das Skript erzeugt keine Ausgabe, da die close() Methode die Abbildung löscht und das Fenster schließt; wir werden mit dem plt.show() Prozess nichts sehen.

Suraj Joshi is a backend software engineer at Matrice.ai.
LinkedInVerwandter Artikel - Matplotlib Axes
- X-Achse drehen Beschriftungstext in der Matplotlib ankreuzen
- Wie man die Schriftgröße von Tick Labels in Matplotlib einstellt
- Hinzufügen einer y-Achsenbeschriftung zur sekundären y-Achse in Matplotlib
- Wie werden logarithmische Achsen in Matplotlib gezeichnet
- Wie man einen quadratischen Plot mit gleichen Achsen in Matplotlib erstellt
- Wie man Grenzen für Achsen in Matplotlib setzt