Matplotlib の cla()、clf() および close() メソッドの違い

matplotlib.pyplot.cla() メソッドは現在の軸をクリアし、matplotlib.pyplot.clf() メソッドは現在の図形をクリアし、matplotlib.pyplot.close() メソッドはウィンドウ全体を閉じます。
import math
import numpy as np
import matplotlib.pyplot as plt

x = np.linspace(0, 2 * math.pi, 100)
y1 = np.sin(x)
y2 = np.cos(x)

fig, ax = plt.subplots(2, 1)
ax[0].plot(x, y1)
ax[0].set_xlabel("x")
ax[0].set_ylabel("sinx")
ax[0].set_title("Plot of sinx")

ax[1].plot(x, y2)
ax[1].set_xlabel("x")
ax[1].set_ylabel("cosx")
ax[1].set_title("Plot of cosx")

fig.suptitle("Plot of sinx and cosx", fontsize=16)
fig.tight_layout(pad=3.0)

plt.show()
出力:
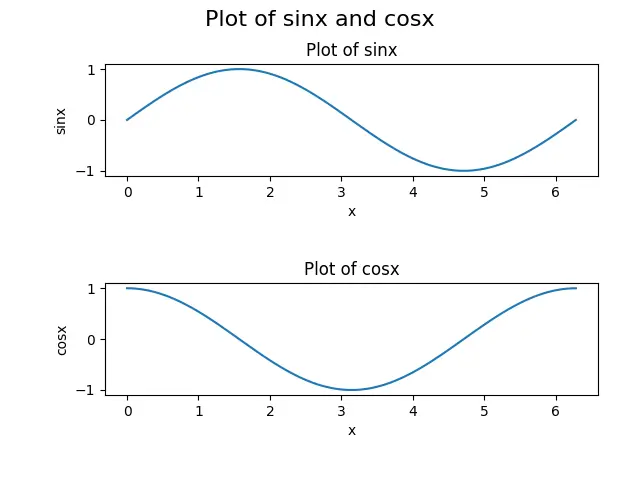
この図を用いて、これらの関数について説明します。cla()、clf()、close() です。この図は 2つのサブプロットで構成されており、上段のサブプロットは sinx 関数のプロット、下段のサブプロットは cosx 関数のプロットを表しています。
matplotlib.pyplot.cla()
matplotlib.pyplot.cla() コマンドは、Matplotlib の現在の軸をクリアするために使用されます。axis は単に図の一部、通常はサブプロットとその詳細です。
例:matplotlib.pyplot.cla())
import math
import numpy as np
import matplotlib.pyplot as plt

x = np.linspace(0, 2 * math.pi, 100)
y1 = np.sin(x)
y2 = np.cos(x)

fig, ax = plt.subplots(2, 1)
ax[0].plot(x, y1)
ax[0].set_xlabel("x")
ax[0].set_ylabel("sinx")
ax[0].set_title("Plot of sinx")

ax[1].plot(x, y2)
ax[1].set_xlabel("x")
ax[1].set_ylabel("cosx")
ax[1].set_title("Plot of cosx")
ax[1].cla()

fig.suptitle("Plot of sinx and cosx", fontsize=16)
fig.tight_layout(pad=3.0)

plt.show()
出力:
-example-in-Matplotlib-Python.webp)
ここでは、cla() メソッドが ax[1] 軸、つまりサブプロットの 2 行目をクリアしていることがわかります。軸をクリアするということは、xlabel、ylabel、title などの詳細を含むサブプロットを削除することを意味するが、ax[0] 軸や最上段のサブプロットは cla() メソッドによって ax[1] 軸だけが呼び出されたため、変更されません。
matplotlib.pyplot.cla()
matplotlib.pyplot.clf() は、Matplotlib 内の図全体をクリアします。図はプロットの全体像と考えることができ、サブプロット、サブ軸、タイトル、凡例のようなプロットのすべての詳細から構成されています。
例:matplotlib.pyplot.clf()
import math
import numpy as np
import matplotlib.pyplot as plt

x = np.linspace(0, 2 * math.pi, 100)
y1 = np.sin(x)
y2 = np.cos(x)

fig, ax = plt.subplots(2, 1)
ax[0].plot(x, y1)
ax[0].set_xlabel("x")
ax[0].set_ylabel("sinx")
ax[0].set_title("Plot of sinx")


ax[1].plot(x, y2)
ax[1].set_xlabel("x")
ax[1].set_ylabel("cosx")
ax[1].set_title("Plot of cosx")

fig.suptitle("Plot of sinx and cosx", fontsize=16)
fig.tight_layout(pad=3.0)

plt.clf()
plt.show()
出力:
-example-in-Matplotlib-Python.webp)
ここでは、clf() メソッドがプロット内のすべてをクリアしていることがわかります。この処理にはすべての軸が含まれていますが、プロットウィンドウはまだ存在しており、他の図を生成するために再利用することができます。
各軸に対して clf() メソッドを使用することはできないことに注意してください。
matplotlib.pyplot.close()
matplotlib.pyplot.close() は、単に Matplotlib の図のウィンドウを閉じているだけで、plt.show() メソッドを呼び出しても何も表示されません。
例:matplotlib.pyplot.close()
import math
import numpy as np
import matplotlib.pyplot as plt

x = np.linspace(0, 2 * math.pi, 100)
y1 = np.sin(x)
y2 = np.cos(x)

fig, ax = plt.subplots(2, 1)
ax[0].plot(x, y1)
ax[0].set_xlabel("x")
ax[0].set_ylabel("sinx")
ax[0].set_title("Plot of sinx")


ax[1].plot(x, y2)
ax[1].set_xlabel("x")
ax[1].set_ylabel("cosx")
ax[1].set_title("Plot of cosx")

fig.suptitle("Plot of sinx and cosx", fontsize=16)
fig.tight_layout(pad=3.0)

plt.close()
plt.show()
close() メソッドが Figure をクリアしてウィンドウを閉じるため、スクリプトは出力を生成しません。plt.show() プロセスを使用しても何も表示されません。

Suraj Joshi is a backend software engineer at Matrice.ai.
LinkedIn