Matplotlib で X 軸の目盛りラベルテキストを回転させる方法
-
Xticks ラベルテキストを回転する
plt.xticks(rotation= ) -
Xticks ラベルテキストを回転するための
fig.autofmt_xdate(rotation= ) -
Xtciks ラベルテキストを回転させるための
ax.set_xticklabels(xlabels, Rotation= ) -
plt.setp(ax.get_xticklabels(), Rotation=)Xticks ラベルテキストを回転させる方法 -
Xticks ラベルテキストを回転させるための
ax.tick_params(axis='x', Labelrotation= ) -
回転した
xticklabelsの整列

このチュートリアル記事では、Python ラベルで X 軸の目盛りラベルテキストを回転させるさまざまな方法を紹介します。含まれています、
plt.xticks(rotation= )fig.autofmt_xdate(rotation= )ax.set_xticklabels(xlabels, rotation= )plt.setp(ax.get_xticklabels(), rotation=)ax.tick_params(axis='x', labelrotation= )
x 軸の目盛りラベルのテキストのデフォルトの方向は水平または 0 度です。目盛りラベルテキストが長すぎると、隣接するラベルテキスト間で重なり合うなど、不都合が生じます。
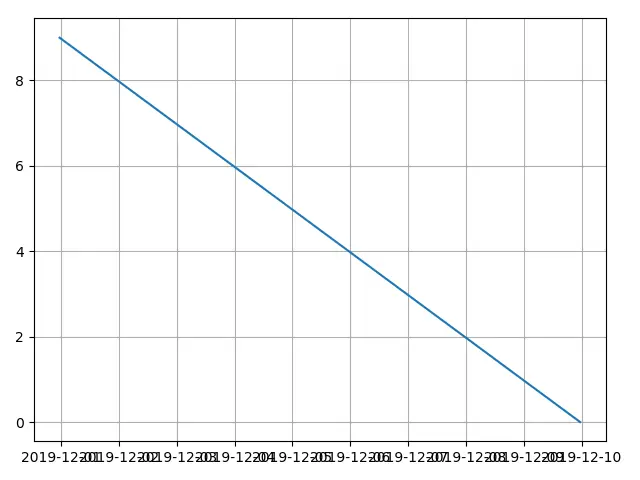
上の図を作成するコードは、
from matplotlib import pyplot as plt
from datetime import datetime, timedelta

values = range(10)
dates = [datetime.now() - timedelta(days=_) for _ in range(10)]

fig, ax = plt.subplots()
plt.plot(dates, values)
plt.grid(True)

plt.show()
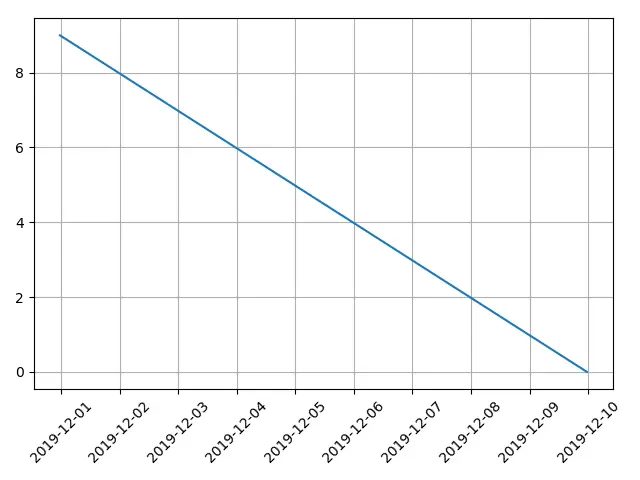
Xticks ラベルテキストを回転する plt.xticks(rotation= )
from matplotlib import pyplot as plt
from datetime import datetime, timedelta

values = range(10)
dates = [datetime.now() - timedelta(days=_) for _ in range(10)]

fig, ax = plt.subplots()
plt.plot(dates, values)
plt.xticks(rotation=45)
plt.grid(True)

plt.show()
plt.xticks(rotation=45)
plt.xticks は、x 軸の目盛りの位置とラベルのプロパティを取得または設定します。
rotation は、x 軸のラベルテキストの反時計回りの回転角度です。
Xticks ラベルテキストを回転するための fig.autofmt_xdate(rotation= )
from matplotlib import pyplot as plt
from datetime import datetime, timedelta

values = range(10)
dates = [datetime.now() - timedelta(days=_) for _ in range(10)]

fig, ax = plt.subplots()
plt.plot(dates, values)
fig.autofmt_xdate(rotation=45)
plt.grid(True)

plt.show()
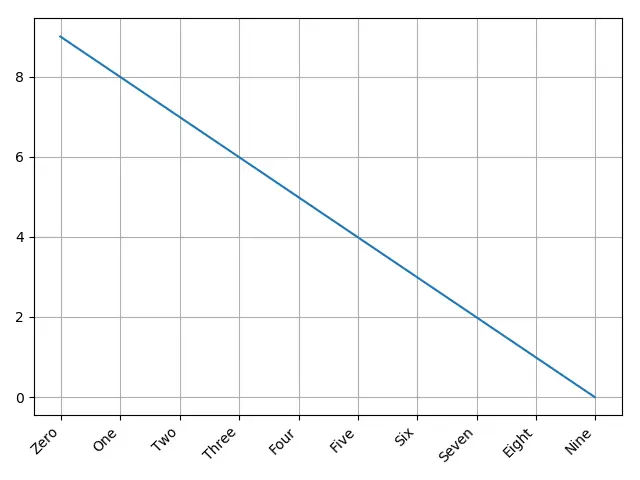
autofmt_xdate は目盛りラベルを回転させ、ラベルが自動的に右揃えされるようにします date オブジェクトです。
しかし実際には、date オブジェクトだけでなく、通常のラベルテキスト文字列でも機能します。
from matplotlib import pyplot as plt
from datetime import datetime, timedelta

values = range(10)
dates = [datetime.now() - timedelta(days=_) for _ in range(10)]
xlabels = [
    "Zero",
    "One",
    "Two",
    "Three",
    "Four",
    "Five",
    "Six",
    "Seven",
    "Eight",
    "Nine",
]

fig, ax = plt.subplots()
plt.plot(dates, values)
ax.set_xticklabels(xlabels)
fig.autofmt_xdate(rotation=45)
plt.grid(True)

plt.show()
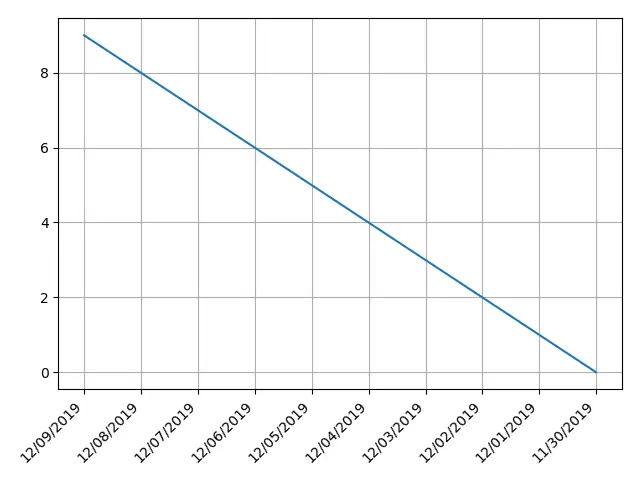
Xtciks ラベルテキストを回転させるための ax.set_xticklabels(xlabels, Rotation= )
set_xticklabels は x-tick ラベルを文字列ラベルのリストで設定します。
この文字列ラベルのリストは、新しく指定されたリスト、または get_xticklabels() によって読み込まれた現在のプロットの既存のラベルリストです。
from matplotlib import pyplot as plt
from datetime import datetime, timedelta

values = range(10)
dates = [datetime.now() - timedelta(days=_) for _ in range(10)]
xlabels = [
    datetime.strftime(datetime.now() - timedelta(days=_), "%m/%d/%Y") for _ in range(10)
]

fig, ax = plt.subplots()
plt.plot(dates, values)
ax.set_xticklabels(xlabels, rotation=45, ha="right")
plt.grid(True)

plt.show()
plt.setp(ax.get_xticklabels(), Rotation=) Xticks ラベルテキストを回転させる方法
matplotlib.pyplot.setp はアーティストオブジェクトにプロパティを設定します。
plt.setp(ax.get_xticklabels(), rotation=) は、xtick ラベルオブジェクトの rotation プロパティを設定します。
from matplotlib import pyplot as plt
from datetime import datetime, timedelta

values = range(10)
dates = [datetime.now() - timedelta(days=_) for _ in range(10)]
xlabels = [
    datetime.strftime(datetime.now() - timedelta(days=_), "%m/%d/%Y") for _ in range(10)
]

fig, ax = plt.subplots()
plt.plot(dates, values)
plt.setp(ax.get_xticklabels(), rotation=45, ha="right")
plt.grid(True)

plt.tight_layout()

plt.show()
Xticks ラベルテキストを回転させるための ax.tick_params(axis='x', Labelrotation= )
tick_params は、目盛り、目盛りラベル、グリッド線のパラメーターを設定します。
ax.tick_params(axis='x', labelrotation= ) は、目盛りラベルの labelrotation プロパティを x 軸、つまり X 軸に設定します。
from matplotlib import pyplot as plt
from datetime import datetime, timedelta

values = range(10)
dates = [datetime.now() - timedelta(days=_) for _ in range(10)]
xlabels = [
    datetime.strftime(datetime.now() - timedelta(days=_), "%m/%d/%Y") for _ in range(10)
]

fig, ax = plt.subplots()
plt.plot(dates, values)

ax.tick_params(axis="x", labelrotation=45)
plt.grid(True)

plt.show()
回転した xticklabels の整列
上記のコード例では引数 ha='right'を使用しています。
ha='right'は、ラベルテキストの右端を目盛りに揃えます。
ha='left'は、ラベルテキストの左端を目盛りに揃えます。
ha='center'は、ラベルテキストの中心を目盛りに揃えます。
from matplotlib import pyplot as plt
from datetime import datetime, timedelta

xvalues = range(5)
yvalues = xvalues
xlabels = [
    datetime.strftime(datetime.now() - timedelta(days=_), "%m/%d/%Y") for _ in xvalues
]

alignment = ["right", "left", "center"]
fig, axes = plt.subplots(1, 3)

for n, ax in enumerate(axes):
    ax.plot(xvalues, yvalues)
    ax.set_title(alignment[n] + "alignment")
    ax.set_xticks(xvalues)
    ax.set_xticklabels(xlabels, rotation=45, ha=alignment[n])
    ax.grid(True)

plt.show()


関連記事 - Matplotlib Axes
- Matplotlib で目盛りラベルのフォントサイズを設定する方法
- Matplotlib でセカンダリ Y 軸に Y 軸ラベルを追加する方法
- Matplotlib で対数軸をプロットする方法
- Matplotlib で軸が等しい正方形のプロットを作成する方法
- Matplotlib で軸の制限を設定する方法