Matplotlib 에서 X 축 눈금 레이블 텍스트를 회전하는 방법
-
Xticks 레이블 텍스트를 회전하는
plt.xticks(rotation= ) -
Xticks 레이블 텍스트를 회전하는
fig.autofmt_xdate(rotation= ) -
Xticks 레이블 텍스트를 회전하는
ax.set_xticklabels(xlabels, Rotation= ) -
Xticks 레이블 텍스트를 회전시키기위한
plt.setp(ax.get_xticklabels(), Rotation=) -
Xticks 레이블 텍스트를 회전하는
ax.tick_params(axis='x', Labelrotation= ) -
회전 된
xticklabels정렬

이 자습서 기사에서는 Python 레이블에서 X 축 눈금 레이블 텍스트를 회전시키는 다양한 방법을 소개합니다. 그것은 포함합니다
plt.xticks(rotation =)fig.autofmt_xdate(rotation =)ax.set_xticklabels(xlabels, rotation =)plt.setp(ax.get_xticklabels(), rotation =)ax.tick_params(axis = 'x', labelrotation =)
x 축에서 눈금 레이블 텍스트의 기본 방향은 가로 또는 0 입니다. 틱 레이블 텍스트가 너무 길면 인접 레이블 텍스트가 겹치는 것처럼 불확실합니다.
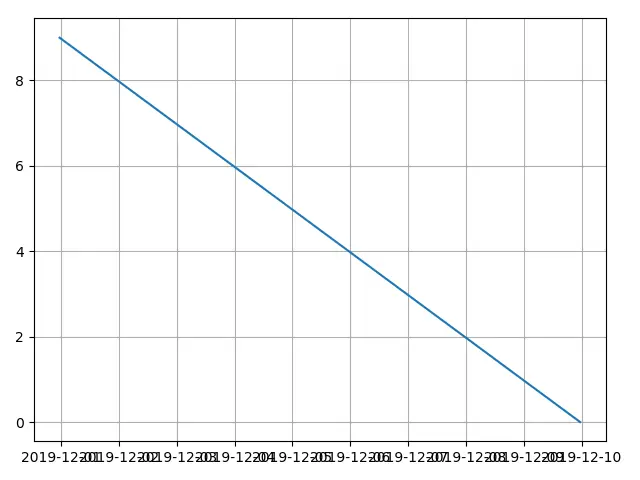
위 그림을 작성하는 코드는 다음과 같습니다.
from matplotlib import pyplot as plt
from datetime import datetime, timedelta

values = range(10)
dates = [datetime.now() - timedelta(days=_) for _ in range(10)]

fig, ax = plt.subplots()
plt.plot(dates, values)
plt.grid(True)

plt.show()
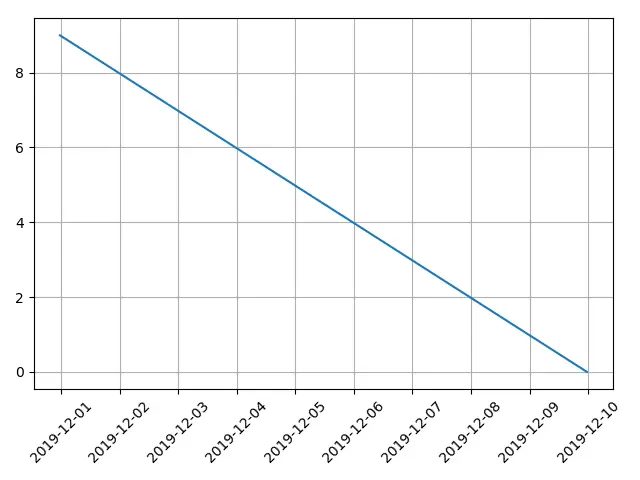
Xticks 레이블 텍스트를 회전하는 plt.xticks(rotation= )
from matplotlib import pyplot as plt
from datetime import datetime, timedelta

values = range(10)
dates = [datetime.now() - timedelta(days=_) for _ in range(10)]

fig, ax = plt.subplots()
plt.plot(dates, values)
plt.xticks(rotation=45)
plt.grid(True)

plt.show()
plt.xticks(rotation=45)
plt.xticks 는 x 축의 눈금 위치 및 레이블의 속성을 가져 오거나 설정합니다.
‘회전’은 x 축 레이블 텍스트의 시계 반대 방향 회전 각도입니다.
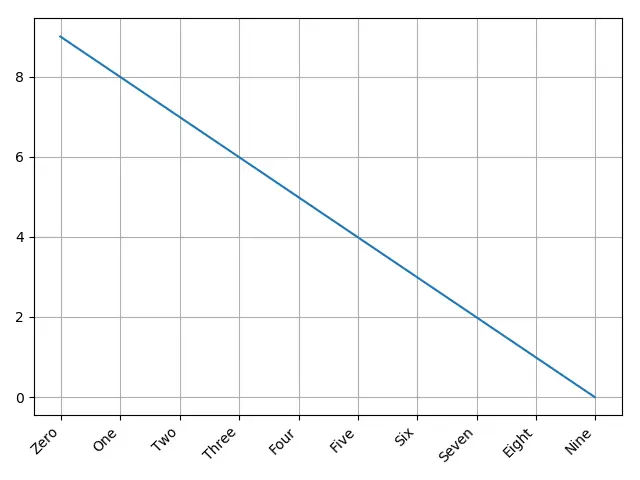
Xticks 레이블 텍스트를 회전하는 fig.autofmt_xdate(rotation= )
from matplotlib import pyplot as plt
from datetime import datetime, timedelta

values = range(10)
dates = [datetime.now() - timedelta(days=_) for _ in range(10)]

fig, ax = plt.subplots()
plt.plot(dates, values)
fig.autofmt_xdate(rotation=45)
plt.grid(True)

plt.show()
autofmt_xdate는 눈금 레이블을 회전시키고 레이블이 자동으로 오른쪽 정렬됩니다 date 객체입니다.
그러나 실제로는 date 객체뿐만 아니라 일반 레이블 텍스트 문자열에서도 작동합니다.
from matplotlib import pyplot as plt
from datetime import datetime, timedelta

values = range(10)
dates = [datetime.now() - timedelta(days=_) for _ in range(10)]
xlabels = [
    "Zero",
    "One",
    "Two",
    "Three",
    "Four",
    "Five",
    "Six",
    "Seven",
    "Eight",
    "Nine",
]

fig, ax = plt.subplots()
plt.plot(dates, values)
ax.set_xticklabels(xlabels)
fig.autofmt_xdate(rotation=45)
plt.grid(True)

plt.show()
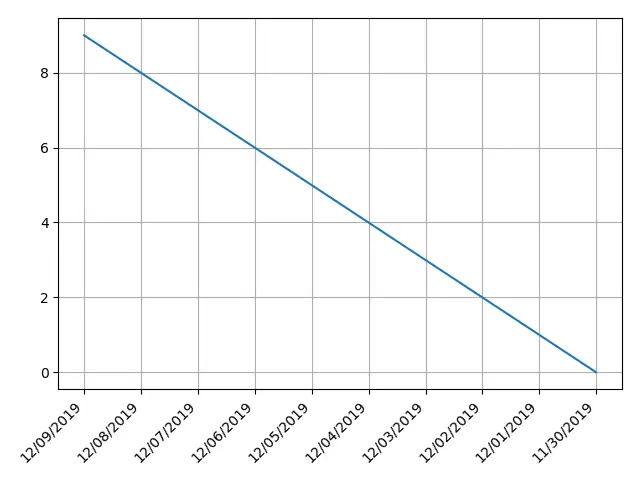
Xticks 레이블 텍스트를 회전하는 ax.set_xticklabels(xlabels, Rotation= )
set_xticklabels 는 x-tick 레이블을 문자열 레이블 목록으로 설정합니다.
이 문자열 레이블 목록은 새로 지정된 목록이거나 get_xticklabels()가 읽은 현재 플롯의 기존 레이블 목록 일 수 있습니다.
from matplotlib import pyplot as plt
from datetime import datetime, timedelta

values = range(10)
dates = [datetime.now() - timedelta(days=_) for _ in range(10)]
xlabels = [
    datetime.strftime(datetime.now() - timedelta(days=_), "%m/%d/%Y") for _ in range(10)
]

fig, ax = plt.subplots()
plt.plot(dates, values)
ax.set_xticklabels(xlabels, rotation=45, ha="right")
plt.grid(True)

plt.show()
Xticks 레이블 텍스트를 회전시키기위한 plt.setp(ax.get_xticklabels(), Rotation=)
matplotlib.pyplot.setp 는 artist object에 속성을 설정합니다.
plt.setp(ax.get_xticklabels(), rotation=)는 xtick labels 객체의 rotation 속성을 설정합니다.
from matplotlib import pyplot as plt
from datetime import datetime, timedelta

values = range(10)
dates = [datetime.now() - timedelta(days=_) for _ in range(10)]
xlabels = [
    datetime.strftime(datetime.now() - timedelta(days=_), "%m/%d/%Y") for _ in range(10)
]

fig, ax = plt.subplots()
plt.plot(dates, values)
plt.setp(ax.get_xticklabels(), rotation=45, ha="right")
plt.grid(True)

plt.tight_layout()

plt.show()
Xticks 레이블 텍스트를 회전하는 ax.tick_params(axis='x', Labelrotation= )
tick_params 는 눈금, 눈금 레이블 및 눈금 선의 매개 변수를 설정합니다.
ax.tick_params(axis='x', labelrotation= )은 x 축 또는 다른 말로 X 축에 눈금 레이블의 labelrotation 속성을 설정합니다.
from matplotlib import pyplot as plt
from datetime import datetime, timedelta

values = range(10)
dates = [datetime.now() - timedelta(days=_) for _ in range(10)]
xlabels = [
    datetime.strftime(datetime.now() - timedelta(days=_), "%m/%d/%Y") for _ in range(10)
]

fig, ax = plt.subplots()
plt.plot(dates, values)

ax.tick_params(axis="x", labelrotation=45)
plt.grid(True)

plt.show()
회전 된 xticklabels정렬
우리는 위 예제 코드에서 ha='right' 인수를 사용하는데, 이는 ** h ** orizontal ** a ** lignment 가 right임을 의미합니다.
ha='right'는 레이블 텍스트의 오른쪽 끝을 눈금에 맞 춥니 다.
ha='left'는 레이블 텍스트의 왼쪽 끝을 눈금에 맞 춥니 다.
ha='center'는 레이블 텍스트의 중심을 눈금에 맞 춥니 다.
from matplotlib import pyplot as plt
from datetime import datetime, timedelta

xvalues = range(5)
yvalues = xvalues
xlabels = [
    datetime.strftime(datetime.now() - timedelta(days=_), "%m/%d/%Y") for _ in xvalues
]

alignment = ["right", "left", "center"]
fig, axes = plt.subplots(1, 3)


for n, ax in enumerate(axes):
    ax.plot(xvalues, yvalues)
    ax.set_title(alignment[n] + "alignment")
    ax.set_xticks(xvalues)
    ax.set_xticklabels(xlabels, rotation=45, ha=alignment[n])
    ax.grid(True)

plt.show()


Founder of DelftStack.com. Jinku has worked in the robotics and automotive industries for over 8 years. He sharpened his coding skills when he needed to do the automatic testing, data collection from remote servers and report creation from the endurance test. He is from an electrical/electronics engineering background but has expanded his interest to embedded electronics, embedded programming and front-/back-end programming.
LinkedIn Facebook관련 문장 - Matplotlib Axes
- Matplotlib 에서 눈금 레이블 글꼴 크기를 설정하는 방법
- Matplotlib에서 2 차 Y 축에 Y 축 레이블을 추가하는 방법
- Matplotlib에서 로그 축을 그리는 방법
- Matplotlib에서 동일한 축으로 정사각형 플롯을 만드는 방법
- Matplotlib에서 축의 한계를 설정하는 방법