Como rodar o texto da etiqueta do eixo X em Matplotlib
-
plt.xticks(rotation= )para Rodar Xticks Texto da etiqueta -
fig.autofmt_xdate(rotation= )para rodar Xticks Label Text -
ax.set_xticklabels(xlabels, Rotation= )para Rotacionar Xticks Texto da etiqueta -
plt.setp(ax.get_xticklabels(), Rotation=)para Rodar Xticks Texto da etiqueta -
ax.tick_params(axis='x', Labelrotation= )para Rotacionar Texto de Rótulo de Xticks -
Rotaciona
xticklabelsalinhando

Neste artigo tutorial, vamos introduzir diferentes métodos para rotacionar o texto do rótulo do eixo X no rótulo Python. Isto inclui,
plt.xticks(rotation= )fig.autofmt_xdate(rotation= )ax.set_xticklabels(xlabels, rotation= )plt.setp(ax.get_xticklabels(), rotation=)ax.tick_params(axis='x', labelrotation= )
A orientação padrão do texto das etiquetas de tick no eixo x é horizontal ou 0 grau. Traz inconviência se o texto da etiqueta do tick for muito longo, como sobreposição entre textos de etiquetas adjacentes.
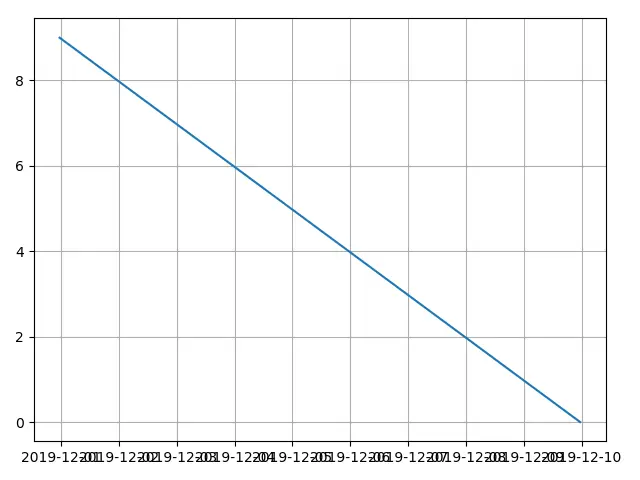
Os códigos para criar a figura acima são,
from matplotlib import pyplot as plt
from datetime import datetime, timedelta

values = range(10)
dates = [datetime.now() - timedelta(days=_) for _ in range(10)]

fig, ax = plt.subplots()
plt.plot(dates, values)
plt.grid(True)

plt.show()
plt.xticks(rotation= ) para Rodar Xticks Texto da etiqueta
from matplotlib import pyplot as plt
from datetime import datetime, timedelta

values = range(10)
dates = [datetime.now() - timedelta(days=_) for _ in range(10)]

fig, ax = plt.subplots()
plt.plot(dates, values)
plt.xticks(rotation=45)
plt.grid(True)

plt.show()
plt.xticks(rotation=45)
O plt.xticks obtém ou define as propriedades dos tick localizações e rótulos do eixo x.
A rotation é o ângulo de rotação no sentido anti-horário do texto da etiqueta do eixo x.
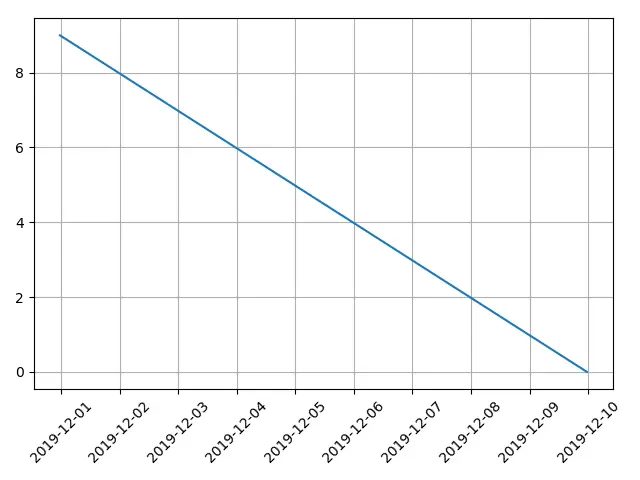
fig.autofmt_xdate(rotation= ) para rodar Xticks Label Text
from matplotlib import pyplot as plt
from datetime import datetime, timedelta

values = range(10)
dates = [datetime.now() - timedelta(days=_) for _ in range(10)]

fig, ax = plt.subplots()
plt.plot(dates, values)
fig.autofmt_xdate(rotation=45)
plt.grid(True)

plt.show()
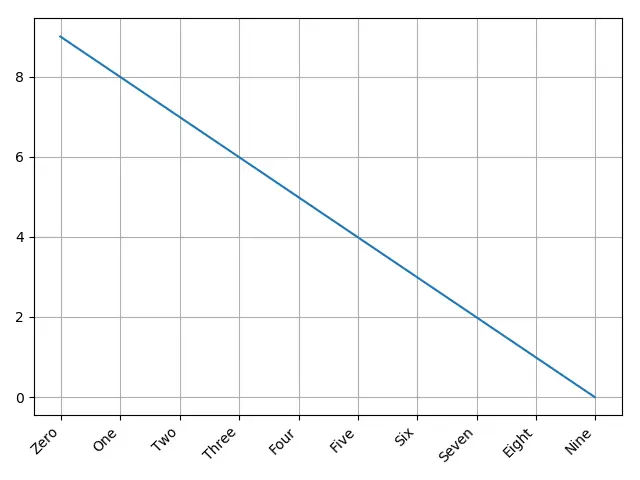
autofmt_xdate gira as etiquetas e as alinha automaticamente se a etiqueta for objeto date.
Mas funciona na verdade não apenas com o objeto date, mas também com a string de texto normal da etiqueta.
from matplotlib import pyplot as plt
from datetime import datetime, timedelta

values = range(10)
dates = [datetime.now() - timedelta(days=_) for _ in range(10)]
xlabels = [
    "Zero",
    "One",
    "Two",
    "Three",
    "Four",
    "Five",
    "Six",
    "Seven",
    "Eight",
    "Nine",
]

fig, ax = plt.subplots()
plt.plot(dates, values)
ax.set_xticklabels(xlabels)
fig.autofmt_xdate(rotation=45)
plt.grid(True)

plt.show()
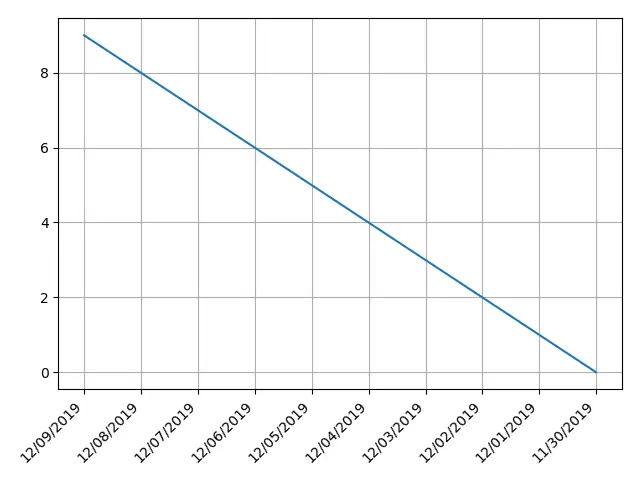
ax.set_xticklabels(xlabels, Rotation= ) para Rotacionar Xticks Texto da etiqueta
O set_xticklabels define as etiquetas de x-tick com lista de etiquetas de string.
Esta lista de etiquetas de string pode ser uma lista recém-especificada ou a lista de etiquetas existente do gráfico atual lida por get_xticklabels().
from matplotlib import pyplot as plt
from datetime import datetime, timedelta

values = range(10)
dates = [datetime.now() - timedelta(days=_) for _ in range(10)]
xlabels = [
    datetime.strftime(datetime.now() - timedelta(days=_), "%m/%d/%Y") for _ in range(10)
]

fig, ax = plt.subplots()
plt.plot(dates, values)
ax.set_xticklabels(xlabels, rotation=45, ha="right")
plt.grid(True)

plt.show()
plt.setp(ax.get_xticklabels(), Rotation=) para Rodar Xticks Texto da etiqueta
matplotlib.pyplot.setp coloca uma propriedade em um objeto artista.
plt.setp(ax.get_xticklabels(), rotation=) define a propriedade rotation do objeto xtick labels.
from matplotlib import pyplot as plt
from datetime import datetime, timedelta

values = range(10)
dates = [datetime.now() - timedelta(days=_) for _ in range(10)]
xlabels = [
    datetime.strftime(datetime.now() - timedelta(days=_), "%m/%d/%Y") for _ in range(10)
]

fig, ax = plt.subplots()
plt.plot(dates, values)
plt.setp(ax.get_xticklabels(), rotation=45, ha="right")
plt.grid(True)

plt.tight_layout()

plt.show()
ax.tick_params(axis='x', Labelrotation= ) para Rotacionar Texto de Rótulo de Xticks
O tick_params define os parâmetros de ticks, tick labels e gridlines.
ax.tick_params(axis='x', labelrotation= ) define a propriedade labelrotation do tick label no eixo x, ou em outras palavras, no eixo X.
from matplotlib import pyplot as plt
from datetime import datetime, timedelta

values = range(10)
dates = [datetime.now() - timedelta(days=_) for _ in range(10)]
xlabels = [
    datetime.strftime(datetime.now() - timedelta(days=_), "%m/%d/%Y") for _ in range(10)
]

fig, ax = plt.subplots()
plt.plot(dates, values)

ax.tick_params(axis="x", labelrotation=45)
plt.grid(True)

plt.show()
Rotaciona xticklabels alinhando
utilizamos o argumento ha='right' nos códigos de exemplo acima, o que significa h*orizontal aligação é right.
ha='right' alinha a extremidade direita do texto da etiqueta com os ticks.
ha='left' alinha a extremidade esquerda do texto da etiqueta com os ticks.
ha='center' alinha o centro do texto da etiqueta com os ticks.
from matplotlib import pyplot as plt
from datetime import datetime, timedelta

xvalues = range(5)
yvalues = xvalues
xlabels = [
    datetime.strftime(datetime.now() - timedelta(days=_), "%m/%d/%Y") for _ in xvalues
]

alignment = ["right", "left", "center"]
fig, axes = plt.subplots(1, 3)


for n, ax in enumerate(axes):
    ax.plot(xvalues, yvalues)
    ax.set_title(alignment[n] + "alignment")
    ax.set_xticks(xvalues)
    ax.set_xticklabels(xlabels, rotation=45, ha=alignment[n])
    ax.grid(True)

plt.show()


Founder of DelftStack.com. Jinku has worked in the robotics and automotive industries for over 8 years. He sharpened his coding skills when he needed to do the automatic testing, data collection from remote servers and report creation from the endurance test. He is from an electrical/electronics engineering background but has expanded his interest to embedded electronics, embedded programming and front-/back-end programming.
LinkedIn FacebookArtigo relacionado - Matplotlib Axes
- Como definir o tamanho da fonte dos Rótulos em Matplotlib
- Como adicionar uma etiqueta do eixo Y ao eixo Y secundário em Matplotlib
- Como plotar eixos logarítmicos em Matplotlib
- Como fazer uma parcela quadrada com eixos iguais em Matplotlib
- Como estabelecer limites para os eixos em Matplotlib