如何在 Matplotlib 中旋轉 X 軸刻度標籤文字
Jinku Hu
2023年1月30日
Matplotlib
Matplotlib Axes
Matplotlib Ticks
-
plt.xticks(rotation= )旋轉 Xticks 標籤文字 -
fig.autofmt_xdate(rotation= )旋轉 Xticks 標籤文字 -
ax.set_xticklabels(xlabels, rotation= )旋轉 Xticks 標籤文字 -
plt.setp(ax.get_xticklabels(), rotation=)旋轉 Xticks 標籤文字 -
ax.tick_params(axis='x', labelrotation= )旋轉 Xticks 標籤文字 -
旋轉
xticklabels對齊

在本教程文章中,我們將介紹在 Python 標籤中旋轉 X 軸刻度標籤文字的不同方法。這包括,
plt.xticks(rotation= )fig.autofmt_xdate(rotation= )ax.set_xticklabels(xlabels, rotation= )plt.setp(ax.get_xticklabels(), rotation=)ax.tick_params(axis='x', labelrotation= )
刻度標籤文字在 X 軸上的預設方向是水平或 0 度。如果刻度標籤文字過長(例如相鄰標籤文字之間重疊),則會帶來不便。
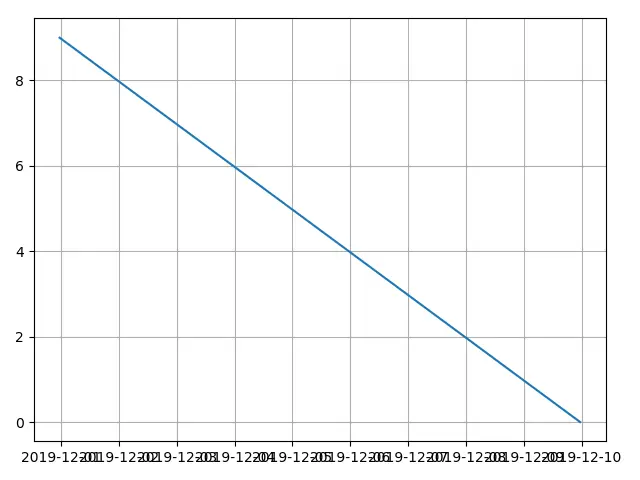
建立上圖的程式碼是,
from matplotlib import pyplot as plt
from datetime import datetime, timedelta

values = range(10)
dates = [datetime.now() - timedelta(days=_) for _ in range(10)]

fig, ax = plt.subplots()
plt.plot(dates, values)
plt.grid(True)

plt.show()
plt.xticks(rotation= ) 旋轉 Xticks 標籤文字
from matplotlib import pyplot as plt
from datetime import datetime, timedelta

values = range(10)
dates = [datetime.now() - timedelta(days=_) for _ in range(10)]

fig, ax = plt.subplots()
plt.plot(dates, values)
plt.xticks(rotation=45)
plt.grid(True)

plt.show()
plt.xticks(rotation=45)
plt.xticks 獲取或設定刻度位置和 x 軸標籤的屬性。
rotation 是 x 軸標籤文字的逆時針旋轉角度。
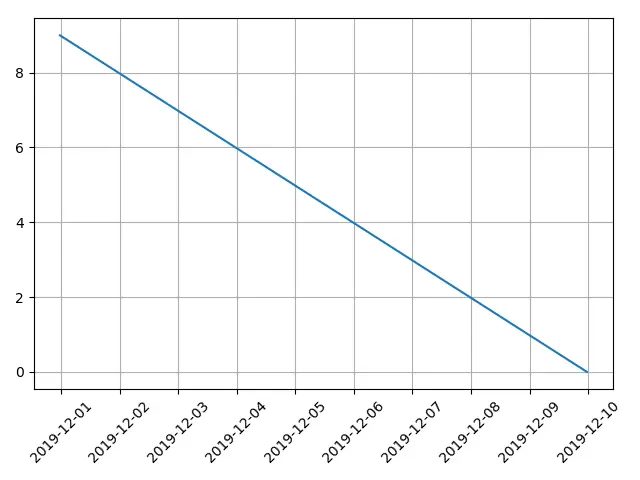
fig.autofmt_xdate(rotation= ) 旋轉 Xticks 標籤文字
from matplotlib import pyplot as plt
from datetime import datetime, timedelta

values = range(10)
dates = [datetime.now() - timedelta(days=_) for _ in range(10)]

fig, ax = plt.subplots()
plt.plot(dates, values)
fig.autofmt_xdate(rotation=45)
plt.grid(True)

plt.show()
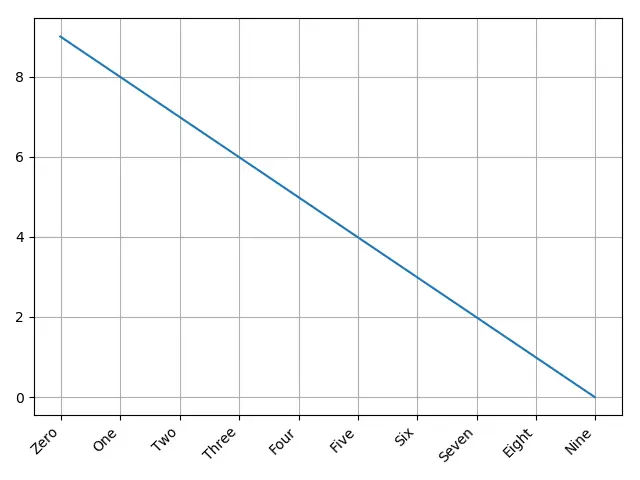
autofmt_xdate 旋轉刻度線標籤,如果標籤是 date 物件,則自動將其右對齊。
但是它實際上不僅適用於 date 物件,而且適用於普通標籤文字字串。
from matplotlib import pyplot as plt
from datetime import datetime, timedelta

values = range(10)
dates = [datetime.now() - timedelta(days=_) for _ in range(10)]
xlabels = [
    "Zero",
    "One",
    "Two",
    "Three",
    "Four",
    "Five",
    "Six",
    "Seven",
    "Eight",
    "Nine",
]

fig, ax = plt.subplots()
plt.plot(dates, values)
ax.set_xticklabels(xlabels)
fig.autofmt_xdate(rotation=45)
plt.grid(True)

plt.show()
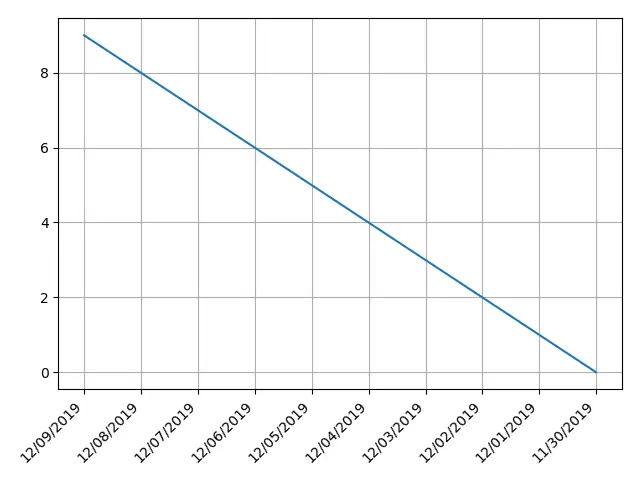
ax.set_xticklabels(xlabels, rotation= ) 旋轉 Xticks 標籤文字
set_xticklabels 設定帶有字串標籤列表的 x-tick 標籤。
字串標籤列表可以是新指定的列表,也可以是當前圖的現有標籤列表,由 get_xticklabels() 來讀取。
from matplotlib import pyplot as plt
from datetime import datetime, timedelta

values = range(10)
dates = [datetime.now() - timedelta(days=_) for _ in range(10)]
xlabels = [
    datetime.strftime(datetime.now() - timedelta(days=_), "%m/%d/%Y") for _ in range(10)
]

fig, ax = plt.subplots()
plt.plot(dates, values)
ax.set_xticklabels(xlabels, rotation=45, ha="right")
plt.grid(True)

plt.show()
plt.setp(ax.get_xticklabels(), rotation=) 旋轉 Xticks 標籤文字
matplotlib.pyplot.setp 設定 artist 物件的屬性。
plt.setp(ax.get_xticklabels(), rotation=) 設定 xtick 標籤物件的 rotation 屬性。
from matplotlib import pyplot as plt
from datetime import datetime, timedelta

values = range(10)
dates = [datetime.now() - timedelta(days=_) for _ in range(10)]
xlabels = [
    datetime.strftime(datetime.now() - timedelta(days=_), "%m/%d/%Y") for _ in range(10)
]

fig, ax = plt.subplots()
plt.plot(dates, values)
plt.setp(ax.get_xticklabels(), rotation=45, ha="right")
plt.grid(True)

plt.tight_layout()

plt.show()
ax.tick_params(axis='x', labelrotation= ) 旋轉 Xticks 標籤文字
tick_params 設定刻度線、刻度線標籤和網格線的引數。
ax.tick_params(axis='x', labelrotation= ) 設定刻度標籤在 x 軸上的 labelrotation 屬性。
from matplotlib import pyplot as plt
from datetime import datetime, timedelta

values = range(10)
dates = [datetime.now() - timedelta(days=_) for _ in range(10)]
xlabels = [
    datetime.strftime(datetime.now() - timedelta(days=_), "%m/%d/%Y") for _ in range(10)
]

fig, ax = plt.subplots()
plt.plot(dates, values)

ax.tick_params(axis="x", labelrotation=45)
plt.grid(True)

plt.show()
旋轉 xticklabels 對齊
在上面的示例程式碼中,我們使用引數 ha='right',該的意思是ħ orizontal alignment 為 right。
ha='right' 將標籤文字的右端與刻度對齊。
ha='left' 將標籤文字的左端與刻度對齊。
ha='center' 使標籤文字的中心與刻度線對齊。
from matplotlib import pyplot as plt
from datetime import datetime, timedelta

xvalues = range(5)
yvalues = xvalues
xlabels = [
    datetime.strftime(datetime.now() - timedelta(days=_), "%m/%d/%Y") for _ in xvalues
]

alignment = ["right", "left", "center"]
fig, axes = plt.subplots(1, 3)

for n, ax in enumerate(axes):
    ax.plot(xvalues, yvalues)
    ax.set_title(alignment[n] + "alignment")
    ax.set_xticks(xvalues)
    ax.set_xticklabels(xlabels, rotation=45, ha=alignment[n])
    ax.grid(True)

plt.show()

Enjoying our tutorials? Subscribe to DelftStack on YouTube to support us in creating more high-quality video guides. Subscribe
作者: Jinku Hu

相關文章 - Matplotlib Axes
- 如何在 Matplotlib 中設定刻度標籤 xticks 字型大小
- 如何在 Matplotlib 中的第二 Y 軸上新增 Y 軸標籤
- 如何在 Matplotlib 中繪製對數軸
- 如何在 Matplotlib 中繪製等軸的正方形圖
- 如何在 Matplotlib 中設定軸的範圍