如何在 Matplotlib 中設定軸的範圍
Suraj Joshi
2024年2月16日
Matplotlib
Matplotlib Axes
-
xlim()和ylim()在 Matplotlib 中設定軸的限制 -
set_xlim()和set_ylim()方法來設定軸限制 -
使用
axis()方法在 Matplotlib 中設定軸的限制
為了設定 X 軸的範圍限制,我們可以使用 xlim() 和 set_xlim() 方法。類似地,為 Y 軸設定範圍限制,我們可以使用 ylim() 和 set_ylim() 方法。我們也可以使用 axis() 方法來控制兩個軸的範圍。
xlim() 和 ylim() 在 Matplotlib 中設定軸的限制
matplotlib.pyplot.xlim() 和 matplotlib.pyplot.ylim() 可用於分別設定或獲取 X 軸和 Y 軸的範圍限制。如果在這些方法中傳遞引數,則它們將設定各個軸的極限,如果不傳遞任何引數,則將獲得各個軸的範圍。
import numpy as np
import matplotlib.pyplot as plt

x = np.linspace(0, 10, 500)
y = np.sin(2 * np.pi * x) + 1

fig = plt.figure(figsize=(8, 6))
plt.plot(x, y)
plt.title("Setting range of Axes", fontsize=25)
plt.xlabel("x", fontsize=18)
plt.ylabel("1+sinx", fontsize=18)
plt.xlim(4, 8)
plt.ylim(-0.5, 2.5)
plt.show()
輸出:
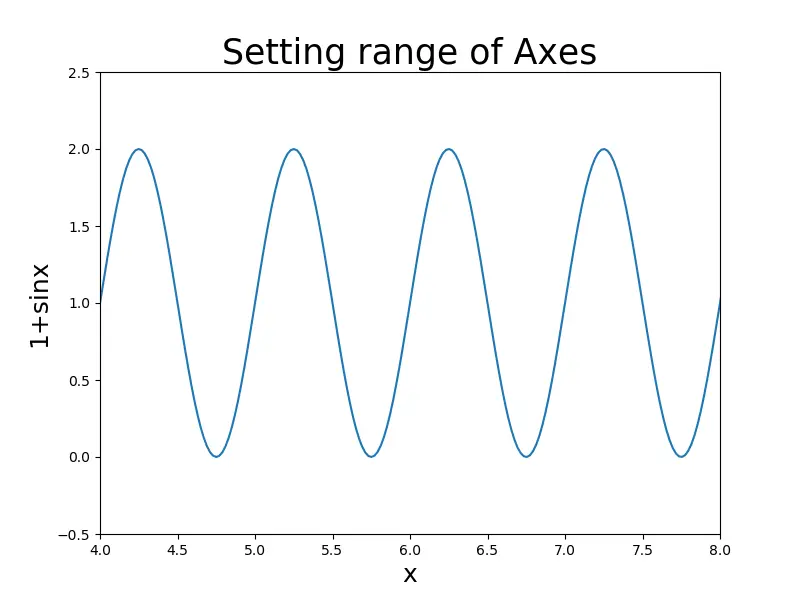
這會將 X 軸的範圍從 4 設定為 8,而將 Y 軸的範圍從 -0.5 設定為 2.5。
import numpy as np
import matplotlib.pyplot as plt

x = np.linspace(1, 10, 500)
y = np.sin(2 * np.pi * x) + 1

fig = plt.figure(figsize=(8, 6))
plt.plot(x, y)
plt.title("Plot without limiting axes", fontsize=25)
plt.xlabel("x", fontsize=18)
plt.ylabel("1+sinx", fontsize=18)
plt.show()
輸出:
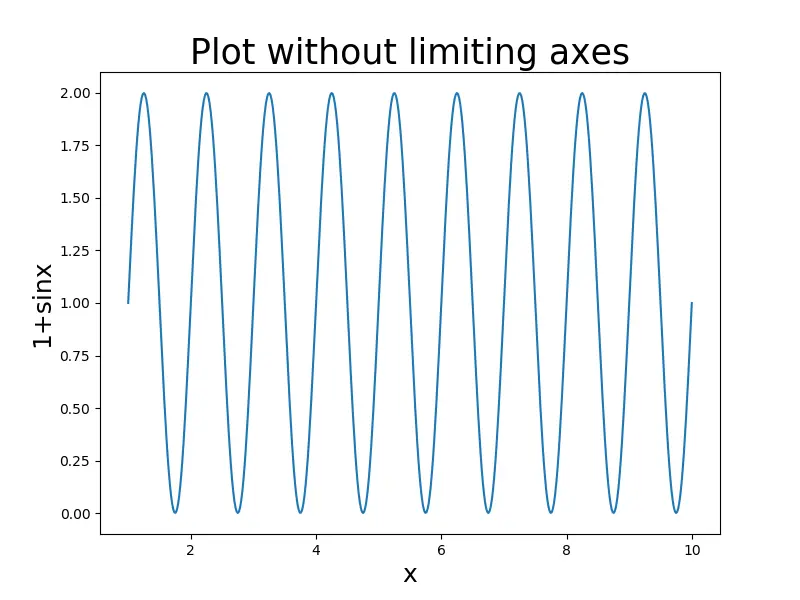
從輸出圖中可以看出,如果不使用 xlim()和 ylim()函式,則會得到一個圖,該圖的整個軸範圍為 X 軸,範圍從 0 到 10,而 Y 軸的範圍從 0 到 2。
set_xlim() 和 set_ylim() 方法來設定軸限制
matplotlib.axes.Axes.set_xlim 和 matplotlib.axes.Axes.set_ylim 也用於設定在結果圖上檢視的數字範圍的限制。
import numpy as np
import matplotlib.pyplot as plt

x = np.linspace(0, 10, 500)
y = np.sin(2 * np.pi * x) + 1

fig = plt.figure(figsize=(8, 6))
axes = plt.axes()
axes.set_xlim([4, 8])
axes.set_ylim([-0.5, 2.5])
plt.plot(x, y)
plt.title("Setting range of Axes", fontsize=25)
plt.xlabel("x", fontsize=18)
plt.ylabel("1+sinx", fontsize=18)
plt.show()
輸出:

使用 axis() 方法在 Matplotlib 中設定軸的限制
我們還可以使用 matplotlib.pyplot.axis() 來設定軸的範圍限制。語法如下:
plt.axis([xmin, xmax, ymin, ymax])
該方法消除了用於控制 X 軸和 Y 軸的單獨功能的需要。
import numpy as np
import matplotlib.pyplot as plt
x = np.linspace(0, 10, 50)
y = np.sin(2 * np.pi * x) + 1
fig = plt.figure(figsize=(8, 6))
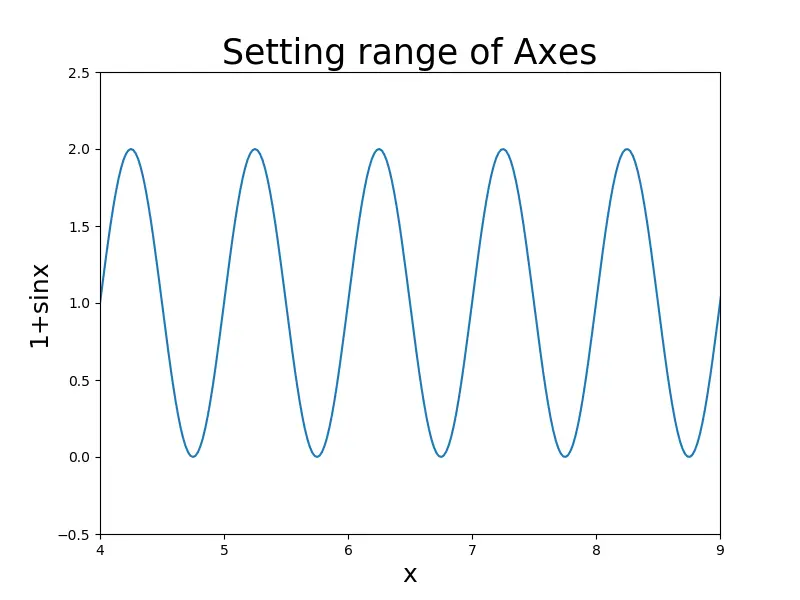
plt.axis([4, 9, -0.5, 2.5])
plt.plot(x, y)
plt.title("Setting range of Axes", fontsize=25)
plt.xlabel("x", fontsize=18)
plt.ylabel("1+sinx", fontsize=18)
plt.show()
輸出:
Enjoying our tutorials? Subscribe to DelftStack on YouTube to support us in creating more high-quality video guides. Subscribe
作者: Suraj Joshi

Suraj Joshi is a backend software engineer at Matrice.ai.
LinkedIn