Matplotlib에서 축의 한계를 설정하는 방법
Suraj Joshi
2024년2월16일
Matplotlib
Matplotlib Axes
-
Matplotlib에서 축의 한계를 설정하는
xlim()및ylim() -
축 제한을 설정하는
set_xlim()및set_ylim()메소드 -
Matplotlib에서 축의 한계를 설정하는
axis()메소드
X 축에 대한 한계를 설정하기 위해xlim()및set_xlim()메소드를 사용할 수 있습니다. Y 축의 한계를 설정하는 것과 마찬가지로ylim()과set_ylim()메소드를 사용할 수 있습니다. 두 축의 범위를 제어 할 수있는axis()메서드를 사용할 수도 있습니다.
Matplotlib에서 축의 한계를 설정하는xlim()및ylim()
matplotlib.pyplot.xlim() 및 matplotlib.pyplot.ylim()을 사용하여 X 축 및 Y 축에 대한 제한을 각각 설정하거나 가져올 수 있습니다. 이 메소드에서 인수를 전달하면 각 축에 대한 한계를 설정하고 인수를 전달하지 않으면 각 축의 범위를 얻습니다.
import numpy as np
import matplotlib.pyplot as plt

x = np.linspace(0, 10, 500)
y = np.sin(2 * np.pi * x) + 1

fig = plt.figure(figsize=(8, 6))
plt.plot(x, y)
plt.title("Setting range of Axes", fontsize=25)
plt.xlabel("x", fontsize=18)
plt.ylabel("1+sinx", fontsize=18)
plt.xlim(4, 8)
plt.ylim(-0.5, 2.5)
plt.show()
출력:
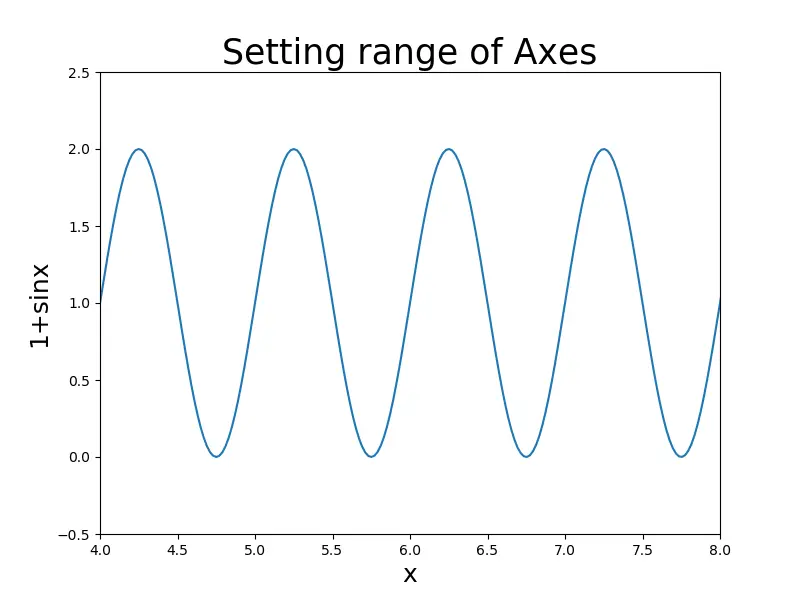
이것은 X 축 범위를4에서8로, Y 축 범위를-0.5에서2.5로 설정합니다.
import numpy as np
import matplotlib.pyplot as plt

x = np.linspace(1, 10, 500)
y = np.sin(2 * np.pi * x) + 1

fig = plt.figure(figsize=(8, 6))
plt.plot(x, y)
plt.title("Plot without limiting axes", fontsize=25)
plt.xlabel("x", fontsize=18)
plt.ylabel("1+sinx", fontsize=18)
plt.show()
출력:
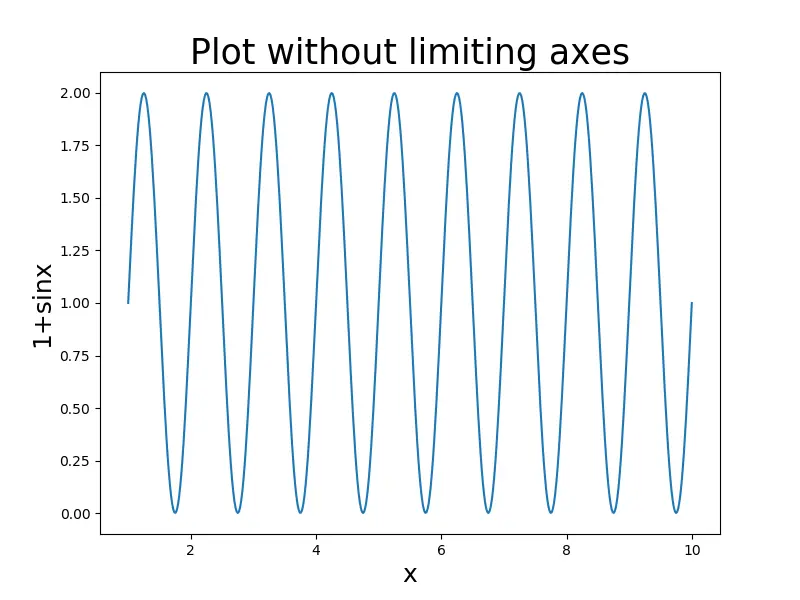
출력 그림에서 볼 수 있듯이, 우리가xlim()및ylim()함수를 사용하지 않으면, 우리는0에서10 사이의 X 축 범위의 모든 범위의 축으로 플롯을 얻을 것입니다 - 축 범위는0에서2 사이입니다.
축 제한을 설정하는set_xlim()및set_ylim()메소드
matplotlib.axes.Axes.set_xlim 및 matplotlib.axes.Axes.set_ylim은 결과 플롯에서 볼 수있는 숫자 범위의 한계를 설정하는 데에도 사용됩니다.
import numpy as np
import matplotlib.pyplot as plt

x = np.linspace(0, 10, 500)
y = np.sin(2 * np.pi * x) + 1

fig = plt.figure(figsize=(8, 6))
axes = plt.axes()
axes.set_xlim([4, 8])
axes.set_ylim([-0.5, 2.5])
plt.plot(x, y)
plt.title("Setting range of Axes", fontsize=25)
plt.xlabel("x", fontsize=18)
plt.ylabel("1+sinx", fontsize=18)
plt.show()
출력:

Matplotlib에서 축의 한계를 설정하는axis()메소드
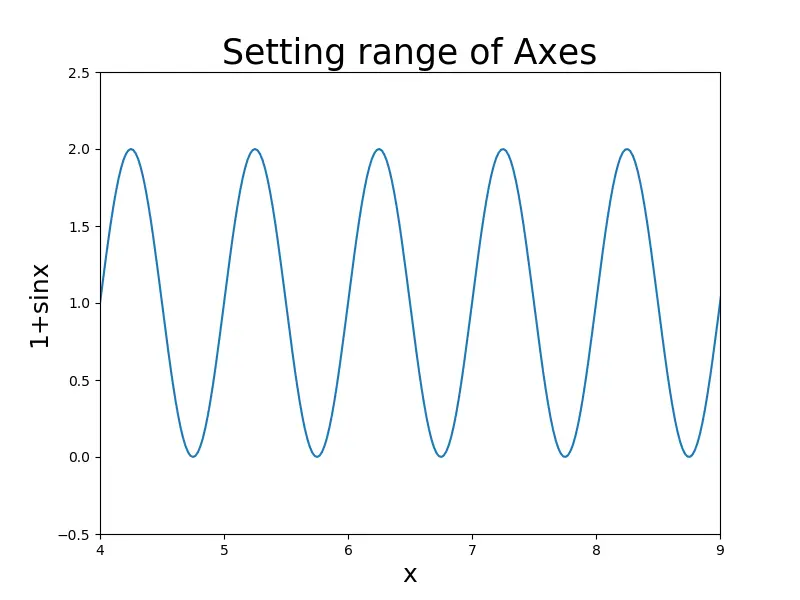
matplotlib.pyplot.axis()을 사용하여 축의 한계를 설정할 수도 있습니다. 구문은 다음과 같습니다.
plt.axis([xmin, xmax, ymin, ymax])
이 방법을 사용하면 X 축과 Y 축을 제어하기위한 별도의 기능이 필요하지 않습니다.
import numpy as np
import matplotlib.pyplot as plt

x = np.linspace(0, 10, 50)
y = np.sin(2 * np.pi * x) + 1

fig = plt.figure(figsize=(8, 6))
plt.axis([4, 9, -0.5, 2.5])
plt.plot(x, y)
plt.title("Setting range of Axes", fontsize=25)
plt.xlabel("x", fontsize=18)
plt.ylabel("1+sinx", fontsize=18)
plt.show()
출력:
튜토리얼이 마음에 드시나요? DelftStack을 구독하세요 YouTube에서 저희가 더 많은 고품질 비디오 가이드를 제작할 수 있도록 지원해주세요. 구독하다
작가: Suraj Joshi

Suraj Joshi is a backend software engineer at Matrice.ai.
LinkedIn