Matplotlib에서 2 차 Y 축에 Y 축 레이블을 추가하는 방법
Suraj Joshi
2023년1월30일
Matplotlib
Matplotlib Axes
우리는axes 객체와 직접 상호 작용하거나 Matplotlib에서 y 축 레이블을 보조 y 축에 추가하기 위해 DataFrame.plot 메서드를 사용할 수 있습니다.
축 객체와 직접 상호 작용
twinx() 함수의 도움으로 두 개의 다른axes 객체를 사용하여 두 개의 다른 y 축으로 플롯을 만들 수 있습니다. 이제 두 번째 ‘축’객체를 사용하여 두 번째 y 축 변수의 플롯을 만들고 레이블을 업데이트 할 수 있습니다.
import numpy as np
import matplotlib.pyplot as plt

a = np.linspace(0, 5, 100)

y1 = np.sin(2 * np.pi * a)
y2 = np.cos(2 * np.pi * a)

fig, ax1 = plt.subplots()

ax1.set_xlabel("time (s)")
ax1.set_ylabel("sin", color="red")
ax1.plot(a, y1, color=color)
ax1.tick_params(axis="y", labelcolor=color)

ax2 = ax1.twinx()
ax2.set_ylabel("cos", color="green")
ax2.plot(a, y2, color=color)
ax2.tick_params(axis="y", labelcolor=color)

fig.tight_layout()
plt.show()
출력:
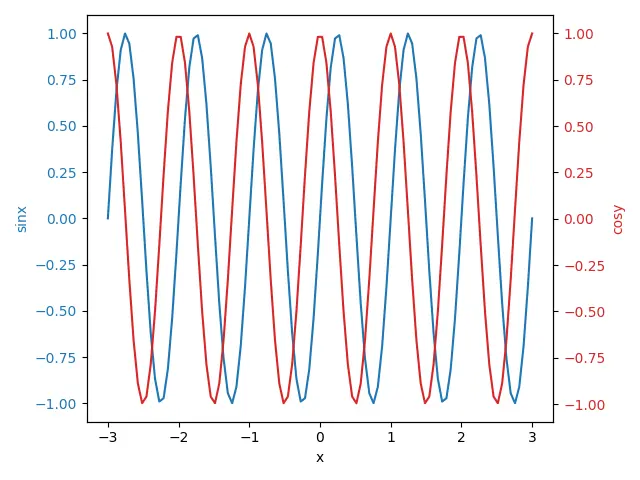
ax2 = ax1.twinx()
Axes.twinx()는 원래 축과 반대 인 y 축 (이 예에서는ax1)으로 새로운Axes를 만듭니다.
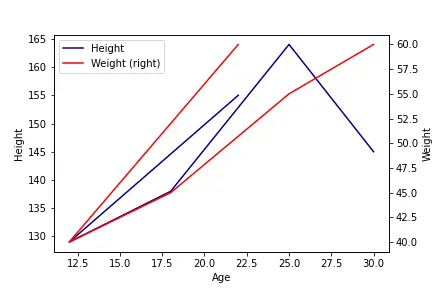
y 축 레이블을 보조 y 축에 추가하는DataFrame.plot 메소드
pandas를 사용하여 y 축 레이블을 보조 y 축에 추가 할 수 있습니다. DataFrame.plot 메소드에서secondary_y 옵션을True로 설정하면 레이블을 설정하는 데 사용할 수있는 다른 축이 반환됩니다.
import pandas as pd
import matplotlib.pyplot as plt

df = pd.DataFrame(
    {
        "Age": [22, 12, 18, 25, 30],
        "Height": [155, 129, 138, 164, 145],
        "Weight": [60, 40, 45, 55, 60],
    }
)
ax = df.plot(kind="line", x="Age", y="Height", color="DarkBlue")

ax2 = df.plot(kind="line", x="Age", y="Weight", secondary_y=True, color="Red", ax=ax)

ax.set_ylabel("Height")
ax2.set_ylabel("Weight")
plt.tight_layout()
plt.show()
출력:
튜토리얼이 마음에 드시나요? DelftStack을 구독하세요 YouTube에서 저희가 더 많은 고품질 비디오 가이드를 제작할 수 있도록 지원해주세요. 구독하다
작가: Suraj Joshi

Suraj Joshi is a backend software engineer at Matrice.ai.
LinkedIn