How to Set Limits for Axes in Matplotlib
-
xlim()andylim()to Set Limits of Axes in Matplotlib -
set_xlim()andset_ylim()Methods to Set Axis Limits -
axis()Method to Set Limits of Axes in Matplotlib
To set the limits for X-axis only, We could use xlim() and set_xlim() methods. Similarly to set the limits for Y-axis, we could use ylim() and set_ylim() methods. We can also use axis() method which can control the range of both axes.
xlim() and ylim() to Set Limits of Axes in Matplotlib
matplotlib.pyplot.xlim() and matplotlib.pyplot.ylim() can be used to set or get limits for X-axis and Y-axis respectively. If we pass arguments in these methods, they set the limits for respective axes and if we do not pass any arguments, we get a range of the respective axes.
import numpy as np
import matplotlib.pyplot as plt

x = np.linspace(0, 10, 500)
y = np.sin(2 * np.pi * x) + 1

fig = plt.figure(figsize=(8, 6))
plt.plot(x, y)
plt.title("Setting range of Axes", fontsize=25)
plt.xlabel("x", fontsize=18)
plt.ylabel("1+sinx", fontsize=18)
plt.xlim(4, 8)
plt.ylim(-0.5, 2.5)
plt.show()
Output:
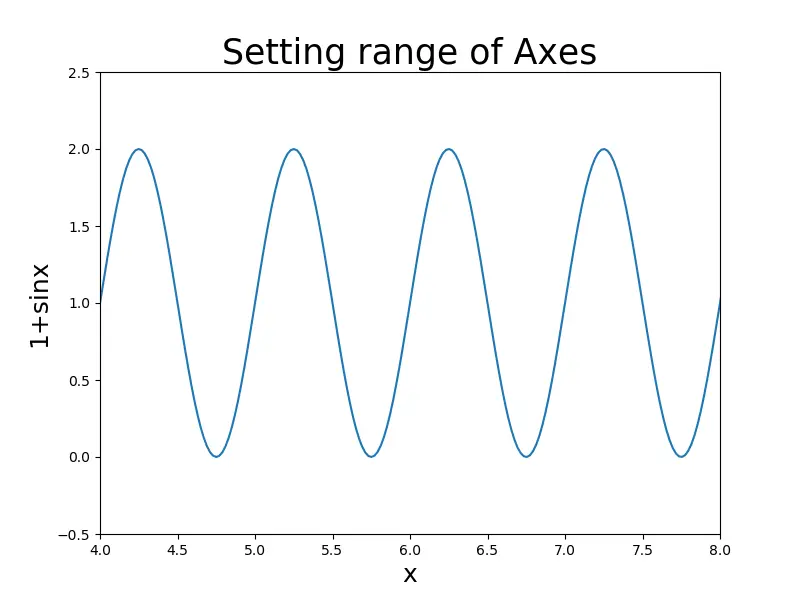
This sets the range of X-axis from 4 to 8 while that of Y-axis from -0.5 to 2.5.
import numpy as np
import matplotlib.pyplot as plt

x = np.linspace(1, 10, 500)
y = np.sin(2 * np.pi * x) + 1

fig = plt.figure(figsize=(8, 6))
plt.plot(x, y)
plt.title("Plot without limiting axes", fontsize=25)
plt.xlabel("x", fontsize=18)
plt.ylabel("1+sinx", fontsize=18)
plt.show()
Output:
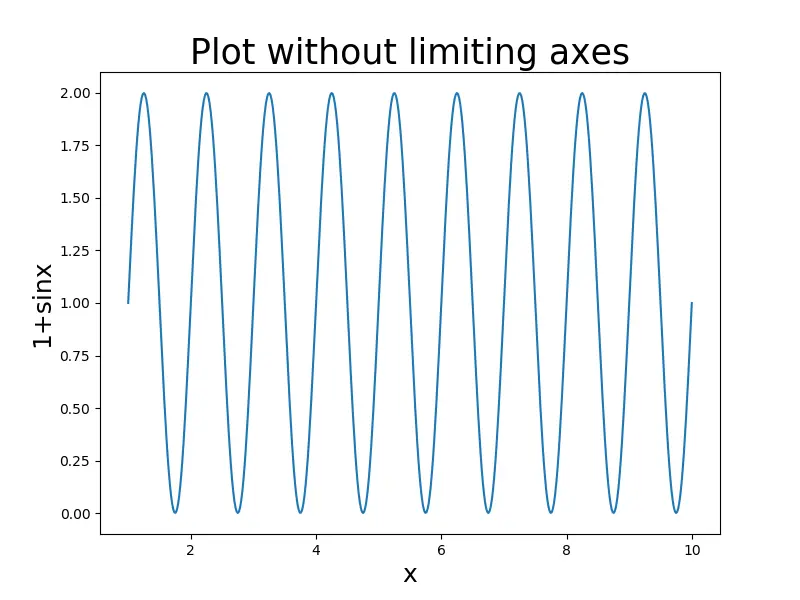
As seen in the output figure, if we didn’t use xlim() and ylim() functions, we would get a plot with the full range of axes that is X-axis ranging from 0 to 10 while Y-axis ranging from 0 to 2.
set_xlim() and set_ylim() Methods to Set Axis Limits
The matplotlib.axes.Axes.set_xlim and matplotlib.axes.Axes.set_ylim are also used to set the limits for range of numbers that are viewed on resulting plot.
import numpy as np
import matplotlib.pyplot as plt

x = np.linspace(0, 10, 500)
y = np.sin(2 * np.pi * x) + 1

fig = plt.figure(figsize=(8, 6))
axes = plt.axes()
axes.set_xlim([4, 8])
axes.set_ylim([-0.5, 2.5])
plt.plot(x, y)
plt.title("Setting range of Axes", fontsize=25)
plt.xlabel("x", fontsize=18)
plt.ylabel("1+sinx", fontsize=18)
plt.show()
Output:

axis() Method to Set Limits of Axes in Matplotlib
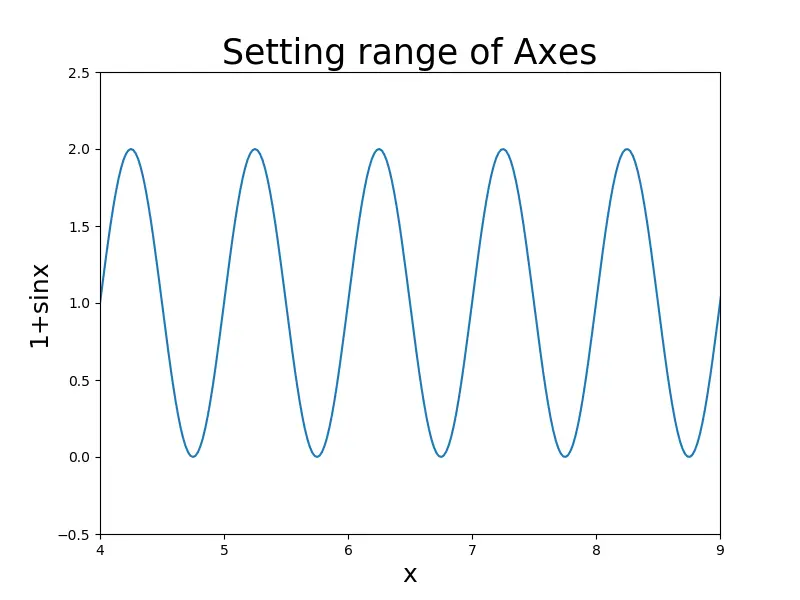
We could also use matplotlib.pyplot.axis() to set limits of axes. The syntax is as follows:
plt.axis([xmin, xmax, ymin, ymax])
This method eliminates need of separate function for controlling X-axis and Y-axis.
import numpy as np
import matplotlib.pyplot as plt

x = np.linspace(0, 10, 50)
y = np.sin(2 * np.pi * x) + 1

fig = plt.figure(figsize=(8, 6))
plt.axis([4, 9, -0.5, 2.5])
plt.plot(x, y)
plt.title("Setting range of Axes", fontsize=25)
plt.xlabel("x", fontsize=18)
plt.ylabel("1+sinx", fontsize=18)
plt.show()
Output:

Suraj Joshi is a backend software engineer at Matrice.ai.
LinkedIn