How to Reverse Axes in Matplotlib
-
invert_xaxis()andinvert_yaxis()Methods -
matplotlib.pyplot.axis()Method -
xlim()andylim()Methods forpyplotObjects
We can revert X-axis and Y-axis in Matplotlib using invert_xaxis() and invert_yaxis() methods for axes objects respectively. We also can use the axis(), xlim(), and ylim() methods for the pyplot object to set minimum and maximum values, through which we can revert the axes.
invert_xaxis() and invert_yaxis() Methods
To revert X-axis, we use matplotlib.axes.Axes.invert_xaxis and to invert Y-axis we use matplotlib.axes.Axes.invert_yaxis. We can revert either any one of the axes or both axes using above methods.
import numpy as np
import matplotlib.pyplot as plt

x = np.linspace(-3, 3, 100)
y = 3 * x + 4

fig, (ax1, ax2) = plt.subplots(1, 2)

ax1.plot(x, y)
ax1.set_title("Normal Plot")

ax2.plot(x, y)
ax2.set_title("Reverted axes")
ax2.invert_xaxis()
ax2.invert_yaxis()

fig.tight_layout()
plt.show()
Output:
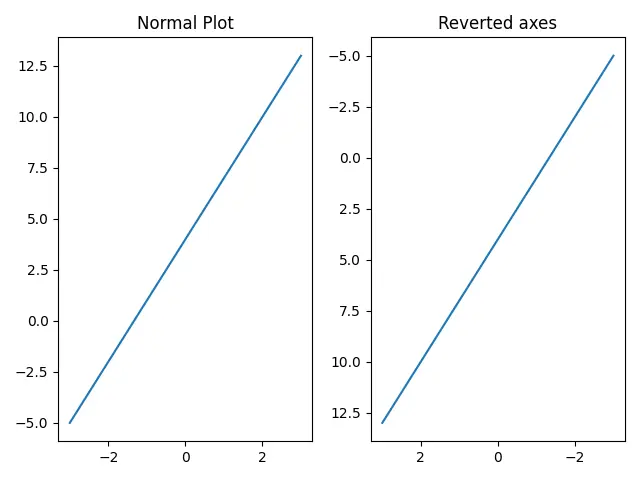
In the output, figure on the left is the plot of x and y with normal axes while the figure on the right has it’s both axes reverted.
If we wish to revert only one of the axes, we can use invert_xaxis() for inverting X-axis only and invert_yaxis() for reverting Y-axis only.
matplotlib.pyplot.axis() Method
The matplotlib.pyplot.axis is used to set the minimum and maximum of the X and Y axes.
Syntax of setting the minimum and maximum values of the X and Y axes.:
matplotlib.pyplot.axis([xmin, xmax, ymin, ymax])
If we interchange the position of xmin and xmax in the above function, X-axis gets reversed. Similarly to reverse the Y-axis, we change the position of ymin and ymax in the above function.
import numpy as np
import matplotlib.pyplot as plt

x = np.linspace(-3, 3, 100)
y = 3 * x + 4

plt.plot(x, y)
plt.title("Reverted axes")
plt.axis([max(x), min(x), max(y), min(y)])

plt.show()
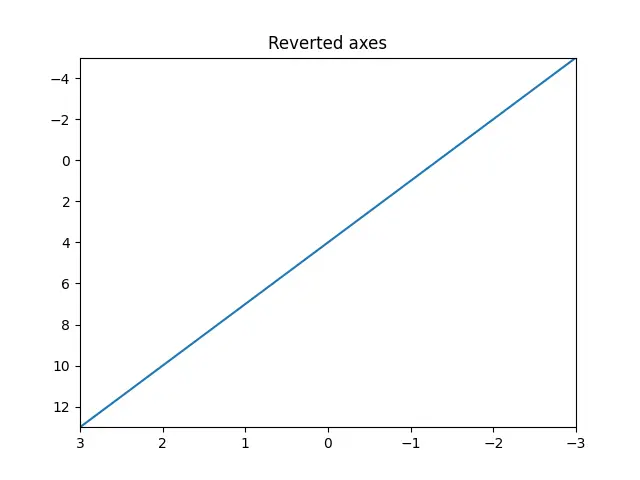
Output:

The functions min and max return the minimum and maximum values in the array respectively.
xlim() and ylim() Methods for pyplot Objects
matplotlib.pyplot.xlim() and matplotlib.pyplot.ylim() can be used to set or get limits for X-axis and Y-axis respectively. If we pass the maximum value in the axis as the lower limit and the minimum value in the axis as the uppper limit in the above functions, we get a reverted axis.
import numpy as np
import matplotlib.pyplot as plt

x = np.linspace(-3, 3, 100)
y = 3 * x + 4

plt.plot(x, y)
plt.title("Reverted axes")
plt.xlim(max(x), min(x))
plt.ylim(max(y), min(y))

plt.show()
Output:

Suraj Joshi is a backend software engineer at Matrice.ai.
LinkedIn