Matplotlib で軸を反転する方法
-
invert_xaxis()およびinvert_yaxis()メソッド -
matplotlib.pyplot.axis()メソッド -
pyplotオブジェクトのxlim()およびylim()メソッド
axes オブジェクトに対してそれぞれ invert_xaxis() メソッドと invert_yaxis() メソッドを使用して、Matplotlib の X 軸と Y 軸を元に戻すことができます。また、pyplot オブジェクトの axis()、xlim()、および ylim() メソッドを使用して、軸を元に戻すことができる最小値と最大値を設定できます。
invert_xaxis() および invert_yaxis() メソッド
X 軸を元に戻すには、matplotlib.axes.Axes.invert_xaxis を使用して Y を反転します使用する軸 matplotlib.axes.Axes.invert_yaxis。上記の方法を使用して、いずれかの軸または両方の軸を元に戻すことができます。
import numpy as np
import matplotlib.pyplot as plt

x = np.linspace(-3, 3, 100)
y = 3 * x + 4

fig, (ax1, ax2) = plt.subplots(1, 2)

ax1.plot(x, y)
ax1.set_title("Normal Plot")

ax2.plot(x, y)
ax2.set_title("Reverted axes")
ax2.invert_xaxis()
ax2.invert_yaxis()

fig.tight_layout()
plt.show()
出力:
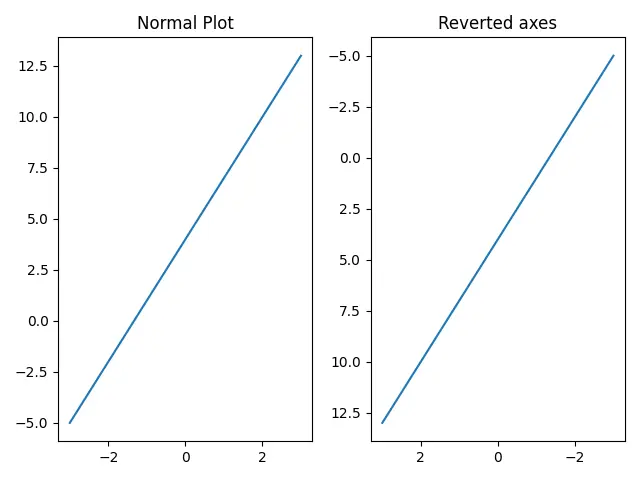
出力では、左側の図は通常の軸での x と y のプロットですが、右側の図は両方の軸が反転されています。
軸の 1つだけを元に戻す場合は、X 軸のみを元に戻すには invert_xaxis() を使用し、Y 軸のみを元に戻すには invert_yaxis() を使用できます。
matplotlib.pyplot.axis() メソッド
matplotlib.pyplot.axis を使用して、X 軸と Y 軸の最小値と最大値を設定します。
X 軸と Y 軸の最小値と最大値を設定する構文:
matplotlib.pyplot.axis([xmin, xmax, ymin, ymax])
上記の関数で xmin と xmax の位置を入れ替えると、X 軸が反転します。同様に、Y 軸を反転させるために、上の関数で ymin と ymax の位置を変更します。
import numpy as np
import matplotlib.pyplot as plt

x = np.linspace(-3, 3, 100)
y = 3 * x + 4

plt.plot(x, y)
plt.title("Reverted axes")
plt.axis([max(x), min(x), max(y), min(y)])

plt.show()
出力:

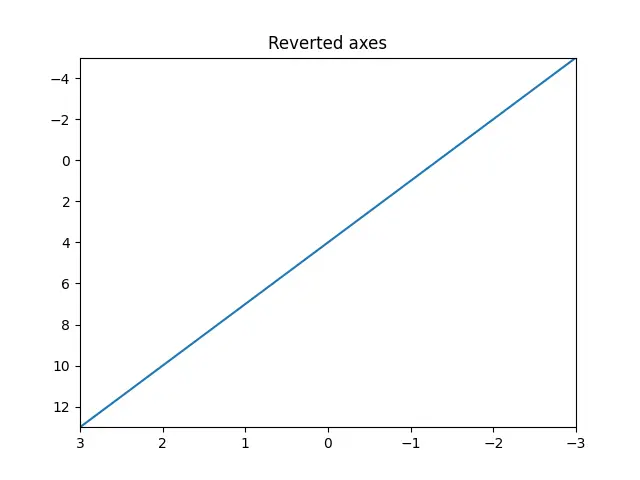
関数 min と max はそれぞれ配列の最小値と最大値を返します。
pyplot オブジェクトの xlim() および ylim() メソッド
matplotlib.pyplot.xlim() および matplotlib.pyplot.ylim() を使用して、X 軸と Y 軸の制限をそれぞれ設定または取得できます。上記の関数で軸の最大値を下限として渡し、軸の最小値を上限として渡すと、元の軸に戻ります。
import numpy as np
import matplotlib.pyplot as plt

x = np.linspace(-3, 3, 100)
y = 3 * x + 4

plt.plot(x, y)
plt.title("Reverted axes")
plt.xlim(max(x), min(x))
plt.ylim(max(y), min(y))

plt.show()
出力:

Suraj Joshi is a backend software engineer at Matrice.ai.
LinkedIn