Cómo girar el texto de la etiqueta de la marca del eje X en Matplotlib
- para rotar el texto de la etiqueta de Xticks
-
fig.autofmt_xdate(rotation= )para rotar el texto de la etiqueta de los Xticks -
ax.set_xticklabels(xlabels, Rotation= )para rotar el texto de la etiqueta de los Xticks -
plt.setp(ax.get_xticklabels(), Rotation=)para rotar el texto de las etiquetas de los Xticks -
ax.tick_params(axis='x', Labelrotation= )para rotar el texto de las etiquetas de Xtick -
Alineación de
xticklabelsrotadas

En este artículo del tutorial, introduciremos diferentes métodos para rotar el texto de la etiqueta de tick del eje X en la etiqueta Python. Incluye,
plt.xticks(rotation= )fig.autofmt_xdate(rotation= )ax.set_xticklabels(xlabels, rotation= )plt.setp(ax.get_xticklabels(), rotation=)ax.tick_params(axis='x', labelrotation= )
La orientación por defecto del texto de las etiquetas de las marcas en el eje x es horizontal o 0 grado. Esto resulta inconviente si el texto de las etiquetas de marca es demasiado largo, como la superposición entre textos de etiquetas adyacentes.
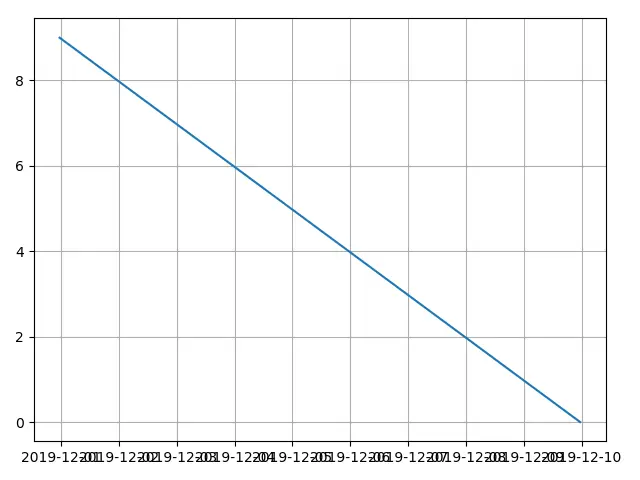
Los códigos para crear la figura anterior son,
from matplotlib import pyplot as plt
from datetime import datetime, timedelta

values = range(10)
dates = [datetime.now() - timedelta(days=_) for _ in range(10)]

fig, ax = plt.subplots()
plt.plot(dates, values)
plt.grid(True)

plt.show()
para rotar el texto de la etiqueta de Xticks
from matplotlib import pyplot as plt
from datetime import datetime, timedelta

values = range(10)
dates = [datetime.now() - timedelta(days=_) for _ in range(10)]

fig, ax = plt.subplots()
plt.plot(dates, values)
plt.xticks(rotation=45)
plt.grid(True)

plt.show()
plt.xticks(rotation=45)
plt.xticks obtiene o establece las propiedades de las ubicaciones de las marcas y etiquetas del eje x.
La rotation es el ángulo de rotación en sentido contrario a las agujas del reloj del texto de las etiquetas del eje x.
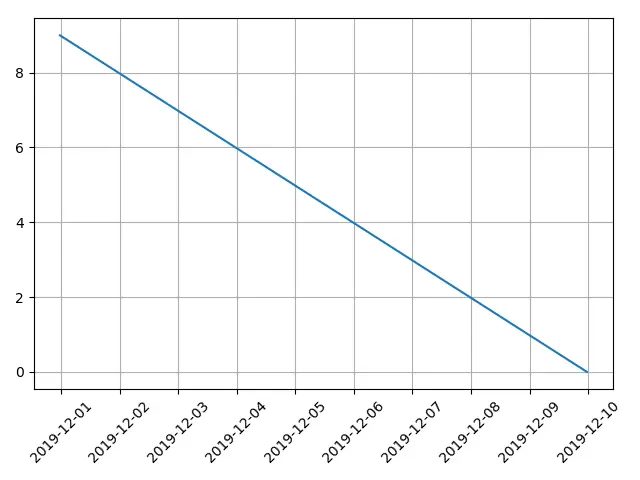
fig.autofmt_xdate(rotation= ) para rotar el texto de la etiqueta de los Xticks
from matplotlib import pyplot as plt
from datetime import datetime, timedelta

values = range(10)
dates = [datetime.now() - timedelta(days=_) for _ in range(10)]

fig, ax = plt.subplots()
plt.plot(dates, values)
fig.autofmt_xdate(rotation=45)
plt.grid(True)

plt.show()
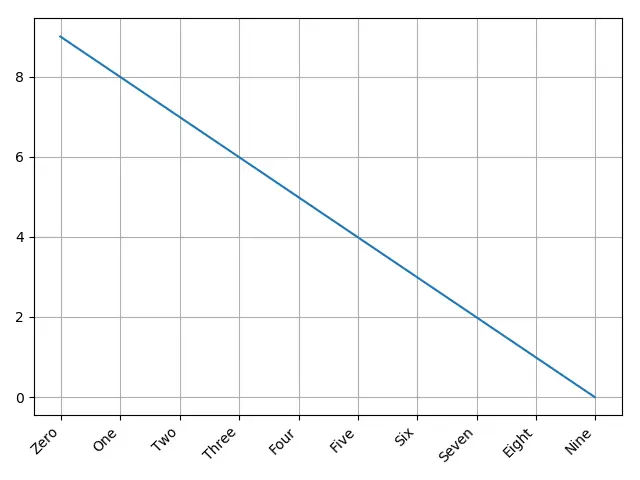
autofmt_xdate rota las etiquetas de las marcas y las alinea automáticamente a la derecha si la etiqueta es un objeto date.
Pero en realidad no sólo funciona con el objeto date sino también con la cadena de texto normal de la etiqueta.
from matplotlib import pyplot as plt
from datetime import datetime, timedelta

values = range(10)
dates = [datetime.now() - timedelta(days=_) for _ in range(10)]
xlabels = [
    "Zero",
    "One",
    "Two",
    "Three",
    "Four",
    "Five",
    "Six",
    "Seven",
    "Eight",
    "Nine",
]

fig, ax = plt.subplots()
plt.plot(dates, values)
ax.set_xticklabels(xlabels)
fig.autofmt_xdate(rotation=45)
plt.grid(True)

plt.show()
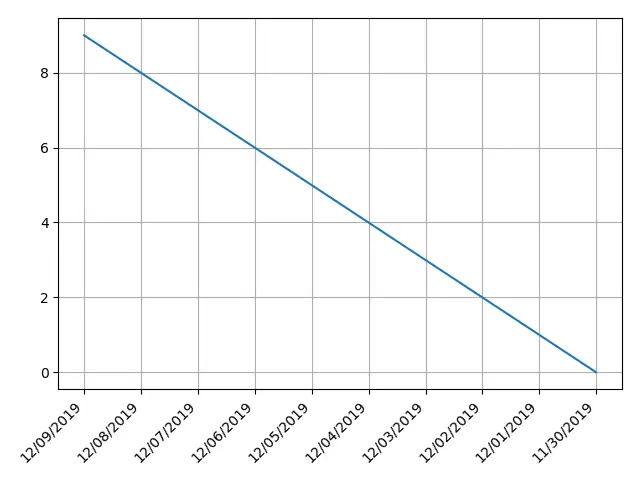
ax.set_xticklabels(xlabels, Rotation= ) para rotar el texto de la etiqueta de los Xticks
set_xticklabels establece las etiquetas x-tick con la lista de etiquetas de cadena.
Esta lista de etiquetas de cadenas puede ser una lista recién especificada o la lista de etiquetas existente del gráfico actual leída por get_xticklabels().
from matplotlib import pyplot as plt
from datetime import datetime, timedelta

values = range(10)
dates = [datetime.now() - timedelta(days=_) for _ in range(10)]
xlabels = [
    datetime.strftime(datetime.now() - timedelta(days=_), "%m/%d/%Y") for _ in range(10)
]

fig, ax = plt.subplots()
plt.plot(dates, values)
ax.set_xticklabels(xlabels, rotation=45, ha="right")
plt.grid(True)

plt.show()
plt.setp(ax.get_xticklabels(), Rotation=) para rotar el texto de las etiquetas de los Xticks
matplotlib.pyplot.setp establece una propiedad sobre un objeto de artista.
plt.setp(ax.get_xticklabels(), rotation=) establece la propiedad rotation del objeto xtick labels.
from matplotlib import pyplot as plt
from datetime import datetime, timedelta

values = range(10)
dates = [datetime.now() - timedelta(days=_) for _ in range(10)]
xlabels = [
    datetime.strftime(datetime.now() - timedelta(days=_), "%m/%d/%Y") for _ in range(10)
]

fig, ax = plt.subplots()
plt.plot(dates, values)
plt.setp(ax.get_xticklabels(), rotation=45, ha="right")
plt.grid(True)

plt.tight_layout()

plt.show()
ax.tick_params(axis='x', Labelrotation= ) para rotar el texto de las etiquetas de Xtick
tick_params establece los parámetros de las garrapatas, etiquetas de garrapata y líneas de la cuadrícula.
ax.tick_params(axis='x', labelrotation= ) establece la propiedad labelrotation de la etiqueta de la marca en el eje x, o en otras palabras, en el eje X.
from matplotlib import pyplot as plt
from datetime import datetime, timedelta

values = range(10)
dates = [datetime.now() - timedelta(days=_) for _ in range(10)]
xlabels = [
    datetime.strftime(datetime.now() - timedelta(days=_), "%m/%d/%Y") for _ in range(10)
]

fig, ax = plt.subplots()
plt.plot(dates, values)

ax.tick_params(axis="x", labelrotation=45)
plt.grid(True)

plt.show()
Alineación de xticklabels rotadas
usamos el argumento ha='right' en los códigos de ejemplo anteriores, lo que significa que horizontal alignment es right.
ha='right' alinea el extremo derecho del texto de la etiqueta con las garrapatas.
ha='left' alinea el extremo izquierdo del texto de la etiqueta con las marcas.
ha='center' alinea el centro del texto de la etiqueta con las marcas.
from matplotlib import pyplot as plt
from datetime import datetime, timedelta

xvalues = range(5)
yvalues = xvalues
xlabels = [
    datetime.strftime(datetime.now() - timedelta(days=_), "%m/%d/%Y") for _ in xvalues
]

alignment = ["right", "left", "center"]
fig, axes = plt.subplots(1, 3)


for n, ax in enumerate(axes):
    ax.plot(xvalues, yvalues)
    ax.set_title(alignment[n] + "alignment")
    ax.set_xticks(xvalues)
    ax.set_xticklabels(xlabels, rotation=45, ha=alignment[n])
    ax.grid(True)

plt.show()


Founder of DelftStack.com. Jinku has worked in the robotics and automotive industries for over 8 years. He sharpened his coding skills when he needed to do the automatic testing, data collection from remote servers and report creation from the endurance test. He is from an electrical/electronics engineering background but has expanded his interest to embedded electronics, embedded programming and front-/back-end programming.
LinkedIn FacebookArtículo relacionado - Matplotlib Axes
- Cómo establecer el tamaño de la fuente de las etiquetas de garrapata en Matplotlib
- Cómo añadir una etiqueta del eje y al eje y secundario en Matplotlib
- Cómo trazar ejes logarítmicos en Matplotlib
- Cómo hacer una gráficos cuadrada con ejes iguales en Matplotlib
- Cómo establecer límites para ejes en Matplotlib