Matplotlib 에서 축 텍스트 눈금 및/또는 눈금 레이블을 숨기는 방법
-
xaxis.set_visible(False)/yaxis.set_visible(False)축label을 포함한 축 숨기기 -
xaxis.set_ticks([])/yaxis.set_ticks([])Matplotlib 에서 축 숨기기 -
xaxis.set_ticklabels([])/yaxis.set_ticklabels([])Matplotlib 에서 축 레이블/텍스트 숨기기 -
xticks(color='w')/yticks(color='w')Matplotlib 에서 축 레이블/텍스트 숨기기
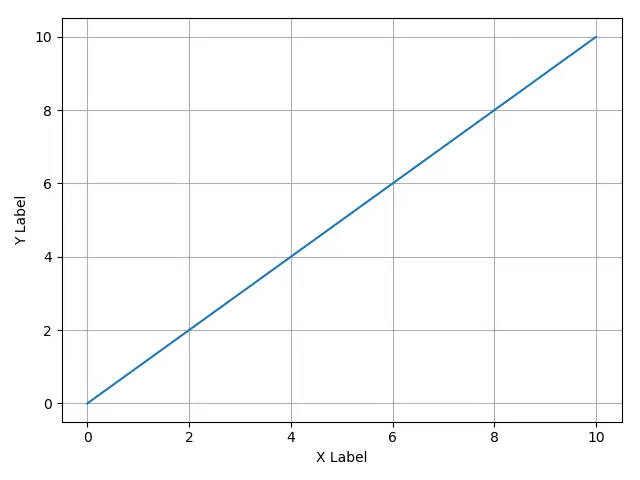
Matplotlib 의 플롯은 기본적으로 예제 그림과 같이 두 개의 ‘축’의 ‘틱’과 ‘틱 레이블’을 보여줍니다.
축 텍스트를 숨기는 방법은 xaxis.set_visible(False),xaxis.set_ticks([])및 xaxis.set_ticklabels([])와 같이 서로 다릅니다. 진드기의 색상이 흰색으로 설정된 경우 Matplotlib 그림의 전경색이 흰색 인 경우에만 축 텍스트가 보이지 않게 될 수 있습니다.
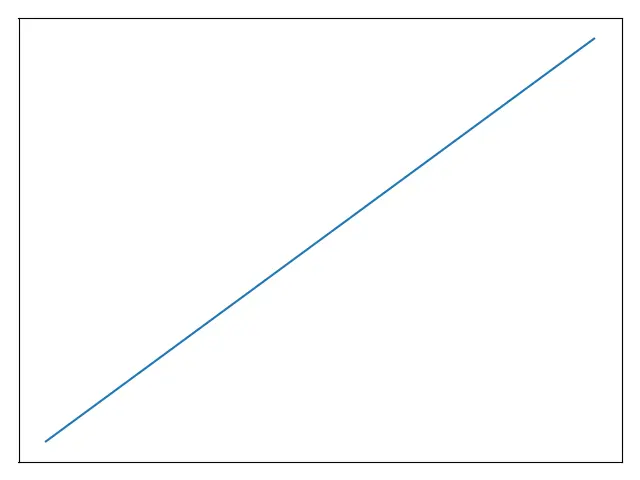
xaxis.set_visible(False)/yaxis.set_visible(False)축 label을 포함한 축 숨기기
이름에서 알 수 있듯이 축 눈금, 축 눈금 레이블 및 축 ‘라벨’을 포함하여 전체 축이 보이지 않게 만듭니다.
import matplotlib.pyplot as plt

plt.plot([0, 10], [0, 10])
plt.xlabel("X Label")
plt.ylabel("Y Label")

ax = plt.gca()
ax.axes.xaxis.set_visible(False)
ax.axes.yaxis.set_visible(False)

plt.grid(True)
plt.show()
xaxis.set_ticks([])/yaxis.set_ticks([])Matplotlib 에서 축 숨기기
x/yaxis.set_ticks([])는 눈금을 비워두고 축 눈금과 레이블을 보이지 않게합니다. 그러나 축 레이블은 영향을받지 않습니다.
import matplotlib.pyplot as plt

plt.plot([0, 10], [0, 10])
plt.xlabel("X Label")
plt.ylabel("Y Label")

ax = plt.gca()
ax.axes.xaxis.set_ticks([])
ax.axes.yaxis.set_ticks([])

plt.grid(True)
plt.show()
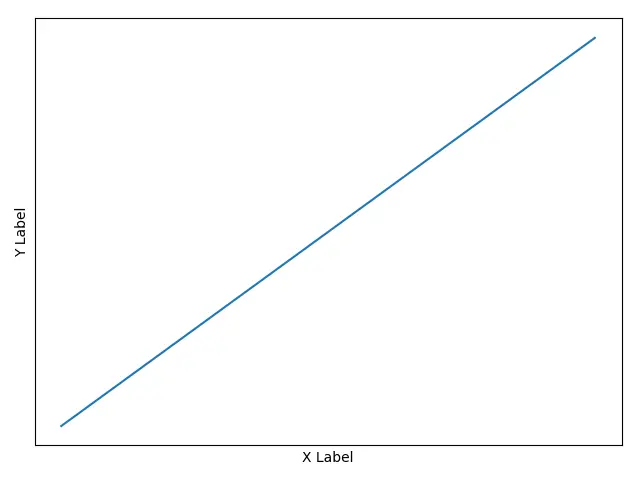
xaxis.set_ticklabels([])/yaxis.set_ticklabels([])Matplotlib 에서 축 레이블/텍스트 숨기기
x/yaxis.set_ticklabels([])는 눈금 텍스트를 빈 텍스트로 설정하여 축 텍스트 (틱 레이블)는 보이지 않지만 눈금은 보이게합니다.
import matplotlib.pyplot as plt

plt.plot([0, 10], [0, 10])
plt.xlabel("X Label")
plt.ylabel("Y Label")

ax = plt.gca()

ax.axes.xaxis.set_ticklabels([])
ax.axes.yaxis.set_ticklabels([])

plt.grid(True)
plt.show()
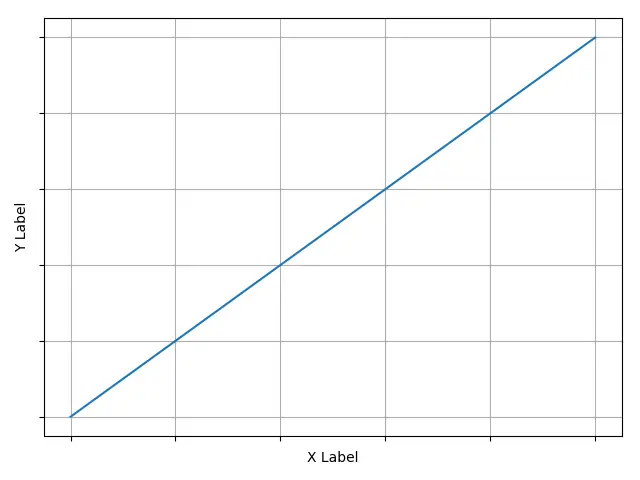
xticks(color='w')/yticks(color='w')Matplotlib 에서 축 레이블/텍스트 숨기기
이 까다로운 방법은 눈금 레이블 또는 눈금을 표시하지 않지만 눈금의 배경이 흰색 (기본 색상) 인 경우 축 텍스트가 실제로 보이지 않도록 눈금 색상을 흰색으로 설정합니다.
import matplotlib.pyplot as plt

plt.plot([0, 10], [0, 10])
plt.xlabel("X Label")
plt.ylabel("Y Label")

plt.xticks(color="w")
plt.yticks(color="w")

plt.grid(True)
plt.show()

Founder of DelftStack.com. Jinku has worked in the robotics and automotive industries for over 8 years. He sharpened his coding skills when he needed to do the automatic testing, data collection from remote servers and report creation from the endurance test. He is from an electrical/electronics engineering background but has expanded his interest to embedded electronics, embedded programming and front-/back-end programming.
LinkedIn Facebook