Matplotlib의 cla(), clf() 및 close() 메서드의 차이점

matplotlib.pyplot.cla()메서드는 현재 좌표축을 지우고matplotlib.pyplot.clf()메서드는 현재 Figure를 지우며matplotlib.pyplot.close()메서드는 전체 창을 닫습니다.
import math
import numpy as np
import matplotlib.pyplot as plt

x = np.linspace(0, 2 * math.pi, 100)
y1 = np.sin(x)
y2 = np.cos(x)

fig, ax = plt.subplots(2, 1)
ax[0].plot(x, y1)
ax[0].set_xlabel("x")
ax[0].set_ylabel("sinx")
ax[0].set_title("Plot of sinx")

ax[1].plot(x, y2)
ax[1].set_xlabel("x")
ax[1].set_ylabel("cosx")
ax[1].set_title("Plot of cosx")

fig.suptitle("Plot of sinx and cosx", fontsize=16)
fig.tight_layout(pad=3.0)

plt.show()
출력:
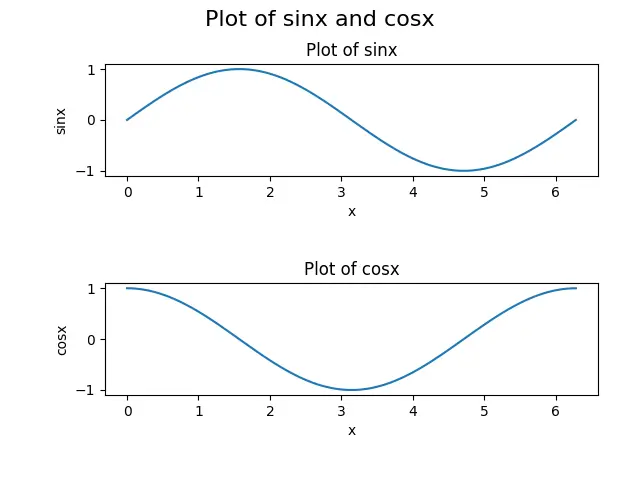
이 그림을 사용하여cla(),clf()및close()함수를 설명합니다. 그림은 두 개의 서브 플롯이있는 그림으로 구성됩니다. 맨 위 행의 서브 플롯은 sinx함수의 플롯이고 맨 아래 행의 서브 플롯은 cosx함수의 플롯을 나타냅니다.
matplotlib.pyplot.cla()
matplotlib.pyplot.cla()명령은 Matplotlib에서 현재 축을 지우는 데 사용됩니다. ‘축’은 단순히 그림의 일부이며 일반적으로 서브 플롯과 세부 정보입니다.
예 :matplotlib.pyplot.cla()
import math
import numpy as np
import matplotlib.pyplot as plt

x = np.linspace(0, 2 * math.pi, 100)
y1 = np.sin(x)
y2 = np.cos(x)

fig, ax = plt.subplots(2, 1)
ax[0].plot(x, y1)
ax[0].set_xlabel("x")
ax[0].set_ylabel("sinx")
ax[0].set_title("Plot of sinx")

ax[1].plot(x, y2)
ax[1].set_xlabel("x")
ax[1].set_ylabel("cosx")
ax[1].set_title("Plot of cosx")
ax[1].cla()

fig.suptitle("Plot of sinx and cosx", fontsize=16)
fig.tight_layout(pad=3.0)

plt.show()
출력:
-example-in-Matplotlib-Python.webp)
여기서 우리는cla()메서드가ax[1]축, 즉 서브 플롯의 두 번째 행을 지우는 것을 볼 수 있습니다. 축을 지우는 것은xlabel,ylabel 및title과 같은 세부 사항이있는 서브 플롯을 제거하는 것을 의미합니다. 그러나ax[0]축 또는 맨 위 행의 서브 플롯은cla()가ax[1]축에 의해서만 호출 되었기 때문에 메서드에 의해 변경되지 않습니다.
matplotlib.pyplot.cla()
matplotlib.pyplot.clf()는 Matplotlib의 전체 그림을 지 웁니다. 그림은 하위 그림, 하위 축, 제목 및 범례와 같은 그림의 모든 세부 사항으로 구성된 그림의 큰 그림으로 간주 할 수 있습니다.
예: matplotlib.pyplot.clf()
import math
import numpy as np
import matplotlib.pyplot as plt

x = np.linspace(0, 2 * math.pi, 100)
y1 = np.sin(x)
y2 = np.cos(x)

fig, ax = plt.subplots(2, 1)
ax[0].plot(x, y1)
ax[0].set_xlabel("x")
ax[0].set_ylabel("sinx")
ax[0].set_title("Plot of sinx")


ax[1].plot(x, y2)
ax[1].set_xlabel("x")
ax[1].set_ylabel("cosx")
ax[1].set_title("Plot of cosx")

fig.suptitle("Plot of sinx and cosx", fontsize=16)
fig.tight_layout(pad=3.0)

plt.clf()
plt.show()
출력:
-example-in-Matplotlib-Python.webp)
여기에서clf()메서드가 플롯의 모든 것을 지우는 것을 볼 수 있습니다. 이 프로세스에는 모든 축이 포함됩니다. 그러나 플롯 창은 여전히 존재하며 다른 수치를 생성하는 데 재사용 할 수 있습니다.
각 축에clf()메서드를 사용할 수 없다는 점을 명심하십시오.
matplotlib.pyplot.close()
matplotlib.pyplot.close()는 Matplotlib에서 Figure 창을 닫고plt.show()메서드를 호출 할 때 아무것도 볼 수 없습니다.
예 :matplotlib.pyplot.close()
import math
import numpy as np
import matplotlib.pyplot as plt

x = np.linspace(0, 2 * math.pi, 100)
y1 = np.sin(x)
y2 = np.cos(x)

fig, ax = plt.subplots(2, 1)
ax[0].plot(x, y1)
ax[0].set_xlabel("x")
ax[0].set_ylabel("sinx")
ax[0].set_title("Plot of sinx")


ax[1].plot(x, y2)
ax[1].set_xlabel("x")
ax[1].set_ylabel("cosx")
ax[1].set_title("Plot of cosx")

fig.suptitle("Plot of sinx and cosx", fontsize=16)
fig.tight_layout(pad=3.0)

plt.close()
plt.show()
close()메서드가 Figure를 지우고 창을 닫으므로 스크립트는 출력을 생성하지 않습니다. plt.show()프로세스를 사용하면 아무것도 볼 수 없습니다.

Suraj Joshi is a backend software engineer at Matrice.ai.
LinkedIn