Matplotlib 中的 twinx 和 twiny
Suraj Joshi
2024年2月15日
Matplotlib
Matplotlib axes
-
在 Python Matplotlib 中使用
matplotlib.axes.Axes.twinx() -
Matplotlib Python 中的
matplotlib.axes.Axes.twiny() -
Matplotlib 中一起使用
twinx()和twiny()
本教程介紹了我們如何在 Python Matplotlib 中使用 matplotlib.axes.Axes.twinx() 和 matplotlib.axes.Axes.twiny() 建立具有共同 X 軸或 Y 軸的雙軸。
在 Python Matplotlib 中使用 matplotlib.axes.Axes.twinx()
函式 matplotlib.axes.Axes.twinx() 在 Matplotlib 圖中建立與初始軸共享 X 軸的其他軸。
import matplotlib.pyplot as plt

students = ["Anil", "Sohit", "Hrishav", "Ayush", "Sunil"]
heights_in_cms = [165, 160, 140, 150, 130]

fig, axes = plt.subplots()
fig.set_size_inches(8, 6)
axes.bar(students, heights_in_cms)
y1, y2 = axes.get_ylim()
axes.set_xlabel("Students", fontsize=12)
axes.set_ylabel("Height in cms", fontsize=12)

twin_axes = axes.twinx()
twin_axes.set_ylim(y1 * 0.394, y2 * 0.394)
twin_axes.set_ylabel("Height in Inches", fontsize=12)

fig.suptitle("Plot using matplotlib.axes.Axes.twinx()", fontsize=15)
plt.show()
輸出:
.webp)
它建立了一個學生身高的條形圖。左邊的 Y 軸標籤代表學生的身高,單位是 cm,右邊的 Y 軸標籤代表學生的身高,單位是 inches。
在這種情況下,我們建立一個新的軸 twin_axes,與 axes 共享 X 軸。axes 的 Y 軸的標籤設定為 Height in cms,而 twin_axes 的 Y 軸設定為 Height in Inches。
Matplotlib Python 中的 matplotlib.axes.Axes.twiny()
函式 matplotlib.axes.Axes.twiny() 在 Matplotlib 圖中建立與初始軸共享 Y 軸的其他軸。
import matplotlib.pyplot as plt

distance_in_kms = [10, 20, 30, 40, 50]
fare_in_dollars = [2, 3.5, 5, 7, 10]

fig, axes = plt.subplots()
fig.set_size_inches(10, 8)
axes.plot(distance_in_kms, fare_in_dollars)
x1, x2 = axes.get_xlim()
axes.set_xlabel("Distance in kms", fontsize=12)
axes.set_ylabel("Fare ($)", fontsize=12)

twin_axes = axes.twiny()
twin_axes.set_xlim(x1 * 0.62, x2 * 0.62)
twin_axes.set_xlabel("Distance in miles", fontsize=12)

fig.suptitle("Plot using matplotlib.axes.Axes.twiny()", fontsize=15)
plt.show()
輸出:
.webp)
我們建立一個新的軸 twin_axes,與 axes 共享 Y 軸。axes 的 X 軸的標籤設定為 Distance in kms,而 twin_axes 的 X 軸設定為 Distance in miles。
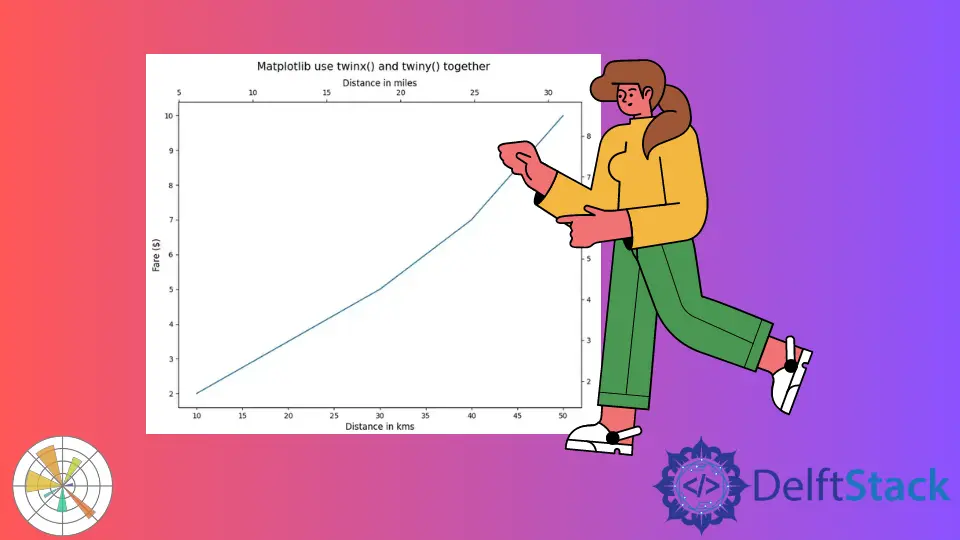
Matplotlib 中一起使用 twinx() 和 twiny()
import matplotlib.pyplot as plt

distance_in_kms = [10, 20, 30, 40, 50]
fare_in_dollars = [2, 3.5, 5, 7, 10]

fig, axes = plt.subplots()
fig.set_size_inches(10, 8)
axes.plot(distance_in_kms, fare_in_dollars)
x1, x2 = axes.get_xlim()
y1, y2 = axes.get_ylim()
axes.set_xlabel("Distance in kms", fontsize=12)
axes.set_ylabel("Fare ($)", fontsize=12)

twin_axes = axes.twinx().twiny()

twin_axes.set_ylim(y1 * 0.85, y2 * 0.85)
twin_axes.set_ylabel("Fare in Euros", fontsize=12)

twin_axes.set_xlim(x1 * 0.62, x2 * 0.62)
twin_axes.set_xlabel("Distance in miles", fontsize=12)

fig.suptitle("Matplotlib use twinx() and twiny() together", fontsize=15)
plt.show()
輸出:
-and-twiny()-together.webp)
它建立一個 Matplotlib 圖,圖的四邊都有刻度線。axes'將控制左邊的 X 軸和底部的 Y 軸,而 twin_axes’將控制右邊的 X 軸和頂部的 Y 軸。
Enjoying our tutorials? Subscribe to DelftStack on YouTube to support us in creating more high-quality video guides. Subscribe
作者: Suraj Joshi

Suraj Joshi is a backend software engineer at Matrice.ai.
LinkedIn