twinx and twiny in Matplotlib
-
matplotlib.axes.Axes.twinx()in Matplotlib Python -
matplotlib.axes.Axes.twiny()in Matplotlib Python -
Matplotlib Use
twinx()andtwiny()Together
This tutorial explains how we can create twin axes in Matplotlib with common X-axis or Y-axis using matplotlib.axes.Axes.twinx() and matplotlib.axes.Axes.twiny() in Python.
matplotlib.axes.Axes.twinx() in Matplotlib Python
The function matplotlib.axes.Axes.twinx() creates other axes in a Matplotlib figure sharing the common X-axis with initial axes.
import matplotlib.pyplot as plt

students = ["Anil", "Sohit", "Hrishav", "Ayush", "Sunil"]
heights_in_cms = [165, 160, 140, 150, 130]

fig, axes = plt.subplots()
fig.set_size_inches(8, 6)
axes.bar(students, heights_in_cms)
y1, y2 = axes.get_ylim()
axes.set_xlabel("Students", fontsize=12)
axes.set_ylabel("Height in cms", fontsize=12)

twin_axes = axes.twinx()
twin_axes.set_ylim(y1 * 0.394, y2 * 0.394)
twin_axes.set_ylabel("Height in Inches", fontsize=12)

fig.suptitle("Plot using matplotlib.axes.Axes.twinx()", fontsize=15)
plt.show()
Output:
.webp)
It creates a bar plot of the height of students. The Y-axis labels at left represent the height of students in cm while the Y-axis labels at right represent students’ height in inches.
In this case, we create a new axis, twin_axes, sharing the X-axis with the axes. The Y-axis of axes has its label set to Height in cms while the Y-axis of twin_axes is set to Height in Inches.
matplotlib.axes.Axes.twiny() in Matplotlib Python
The function matplotlib.axes.Axes.twiny() creates other axes in a Matplotlib figure sharing the common Y-axis with initial axes.
import matplotlib.pyplot as plt

distance_in_kms = [10, 20, 30, 40, 50]
fare_in_dollars = [2, 3.5, 5, 7, 10]

fig, axes = plt.subplots()
fig.set_size_inches(10, 8)
axes.plot(distance_in_kms, fare_in_dollars)
x1, x2 = axes.get_xlim()
axes.set_xlabel("Distance in kms", fontsize=12)
axes.set_ylabel("Fare ($)", fontsize=12)

twin_axes = axes.twiny()
twin_axes.set_xlim(x1 * 0.62, x2 * 0.62)
twin_axes.set_xlabel("Distance in miles", fontsize=12)

fig.suptitle("Plot using matplotlib.axes.Axes.twiny()", fontsize=15)
plt.show()
Output:
.webp)
We create a new axis, twin_axes, sharing the Y-axis with the axes. The X-axis of axes has its label set to Distance in kms while the X-axis of twin_axes is set to Distance in miles.
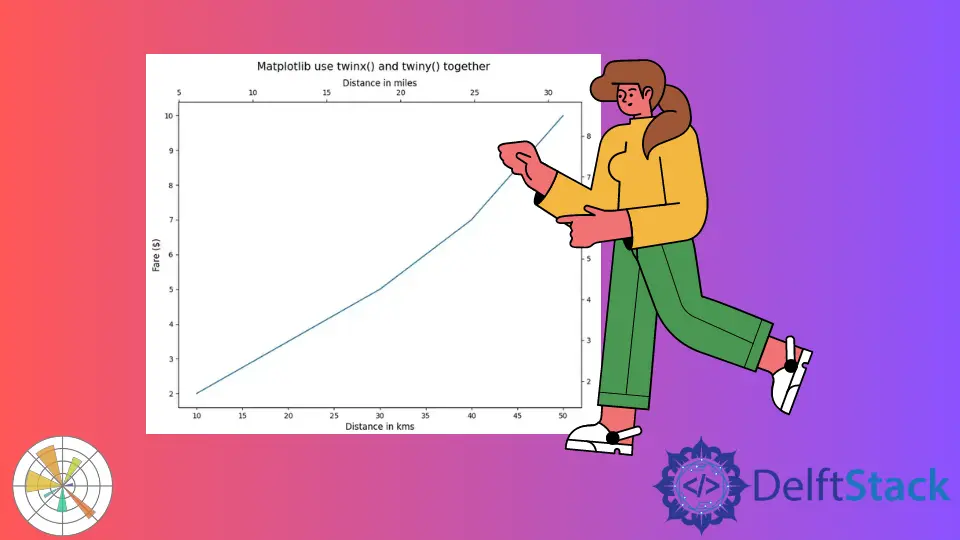
Matplotlib Use twinx() and twiny() Together
import matplotlib.pyplot as plt

distance_in_kms = [10, 20, 30, 40, 50]
fare_in_dollars = [2, 3.5, 5, 7, 10]

fig, axes = plt.subplots()
fig.set_size_inches(10, 8)
axes.plot(distance_in_kms, fare_in_dollars)
x1, x2 = axes.get_xlim()
y1, y2 = axes.get_ylim()
axes.set_xlabel("Distance in kms", fontsize=12)
axes.set_ylabel("Fare ($)", fontsize=12)

twin_axes = axes.twinx().twiny()

twin_axes.set_ylim(y1 * 0.85, y2 * 0.85)
twin_axes.set_ylabel("Fare in Euros", fontsize=12)

twin_axes.set_xlim(x1 * 0.62, x2 * 0.62)
twin_axes.set_xlabel("Distance in miles", fontsize=12)

fig.suptitle("Matplotlib use twinx() and twiny() together", fontsize=15)
plt.show()
Output:
-and-twiny()-together.webp)
It creates a Matplotlib figure with tick marks on all sides of the figure. The axes will control the left X-axis and bottom Y-axis, while the twin_axes will control the right X-axis and top Y-axis.

Suraj Joshi is a backend software engineer at Matrice.ai.
LinkedIn