twinx y twiny en Matplotlib
-
matplotlib.axes.Axes.twinx()en Matplotlib Python -
matplotlib.axes.Axes.twiny()en Matplotlib Python -
Matplotlib Use
twinx()ytwiny()juntos
Este tutorial explica cómo podemos crear ejes gemelos en Matplotlib con un eje X o Y común usando matplotlib.axes.Axes.twinx() y matplotlib.axes.Axes.twiny() en Python.
matplotlib.axes.Axes.twinx() en Matplotlib Python
La función matplotlib.axes.Axes.twinx() crea otros ejes en una figura Matplotlib compartiendo el común axis X con los ejes iniciales.
import matplotlib.pyplot as plt

students = ["Anil", "Sohit", "Hrishav", "Ayush", "Sunil"]
heights_in_cms = [165, 160, 140, 150, 130]

fig, axes = plt.subplots()
fig.set_size_inches(8, 6)
axes.bar(students, heights_in_cms)
y1, y2 = axes.get_ylim()
axes.set_xlabel("Students", fontsize=12)
axes.set_ylabel("Height in cms", fontsize=12)

twin_axes = axes.twinx()
twin_axes.set_ylim(y1 * 0.394, y2 * 0.394)
twin_axes.set_ylabel("Height in Inches", fontsize=12)

fig.suptitle("Plot using matplotlib.axes.Axes.twinx()", fontsize=15)
plt.show()
Producción:
.webp)
Crea una trama de barras de la altura de los estudiantes. Las etiquetas del eje Y a la izquierda representan la altura de los estudiantes en cm mientras que las etiquetas del eje Y a la derecha representan la altura de los estudiantes en inches.
En este caso, creamos un nuevo eje, twin_axes, compartiendo el eje X con los axes. El eje Y de los axes tiene su etiqueta en Height in cms mientras que el eje Y de los twin_axes tiene su etiqueta en Height in Inches.
matplotlib.axes.Axes.twiny() en Matplotlib Python
La función matplotlib.axes.Axes.twiny() crea otros ejes en una figura Matplotlib que comparte el eje Y común con los ejes iniciales.
import matplotlib.pyplot as plt

distance_in_kms = [10, 20, 30, 40, 50]
fare_in_dollars = [2, 3.5, 5, 7, 10]

fig, axes = plt.subplots()
fig.set_size_inches(10, 8)
axes.plot(distance_in_kms, fare_in_dollars)
x1, x2 = axes.get_xlim()
axes.set_xlabel("Distance in kms", fontsize=12)
axes.set_ylabel("Fare ($)", fontsize=12)

twin_axes = axes.twiny()
twin_axes.set_xlim(x1 * 0.62, x2 * 0.62)
twin_axes.set_xlabel("Distance in miles", fontsize=12)

fig.suptitle("Plot using matplotlib.axes.Axes.twiny()", fontsize=15)
plt.show()
Producción:
.webp)
Creamos un nuevo eje, twin_axes, compartiendo el eje Y con los axes. El eje X de los axes tiene su etiqueta en Distance in kms mientras que el eje X de los twin_axes tiene su etiqueta en Distance in miles.
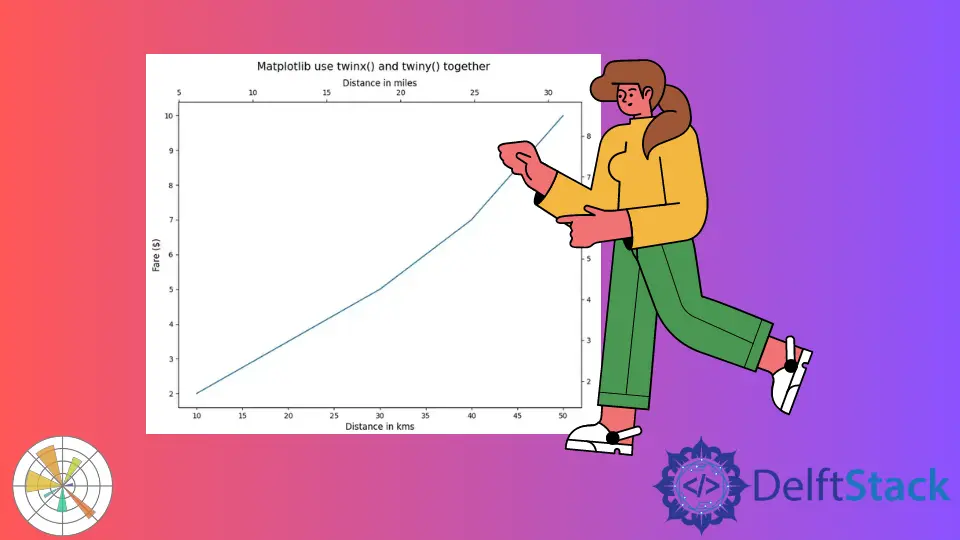
Matplotlib Use twinx() y twiny() juntos
import matplotlib.pyplot as plt

distance_in_kms = [10, 20, 30, 40, 50]
fare_in_dollars = [2, 3.5, 5, 7, 10]

fig, axes = plt.subplots()
fig.set_size_inches(10, 8)
axes.plot(distance_in_kms, fare_in_dollars)
x1, x2 = axes.get_xlim()
y1, y2 = axes.get_ylim()
axes.set_xlabel("Distance in kms", fontsize=12)
axes.set_ylabel("Fare ($)", fontsize=12)

twin_axes = axes.twinx().twiny()

twin_axes.set_ylim(y1 * 0.85, y2 * 0.85)
twin_axes.set_ylabel("Fare in Euros", fontsize=12)

twin_axes.set_xlim(x1 * 0.62, x2 * 0.62)
twin_axes.set_xlabel("Distance in miles", fontsize=12)

fig.suptitle("Matplotlib use twinx() and twiny() together", fontsize=15)
plt.show()
Producción:
-and-twiny()-together.webp)
Crea una figura Matplotlib con marcas de garrapatas en todos los lados de la figura. Los axes controlarán el eje X izquierdo y el eje Y inferior, mientras que los twin_axes controlarán el eje X derecho y el eje Y superior.

Suraj Joshi is a backend software engineer at Matrice.ai.
LinkedIn