twinx und twiny in Matplotlib
-
matplotlib.axes.Axes.twinx()in Matplotlib Python -
matplotlib.axes.Axes.twiny()in Matplotlib Python -
Matplotlib Verwenden Sie
twinx()undtwiny()zusammen
Dieses Tutorial erklärt, wie man in Matplotlib Zwillingsachsen mit gemeinsamer X-Achse oder Y-Achse mit Hilfe von matplotlib.axes.Axes.twinx() und matplotlib.axes.Axes.twiny() in Python erstellen kann.
matplotlib.axes.Axes.twinx() in Matplotlib Python
Die Funktion matplotlib.axes.Axes.twinx() erzeugt weitere Achsen in einer Matplotlib-Figur, die sich die gemeinsame X-Achse mit den ersten Achsen teilen.
import matplotlib.pyplot as plt

students = ["Anil", "Sohit", "Hrishav", "Ayush", "Sunil"]
heights_in_cms = [165, 160, 140, 150, 130]

fig, axes = plt.subplots()
fig.set_size_inches(8, 6)
axes.bar(students, heights_in_cms)
y1, y2 = axes.get_ylim()
axes.set_xlabel("Students", fontsize=12)
axes.set_ylabel("Height in cms", fontsize=12)

twin_axes = axes.twinx()
twin_axes.set_ylim(y1 * 0.394, y2 * 0.394)
twin_axes.set_ylabel("Height in Inches", fontsize=12)

fig.suptitle("Plot using matplotlib.axes.Axes.twinx()", fontsize=15)
plt.show()
Ausgabe:
.webp)
Es wird ein Balkendiagramm für die Höhe der Schüler erstellt. Die Beschriftung der Y-Achse auf der linken Seite stellt die Größe der Schüler in cm dar, während die Beschriftung der Y-Achse auf der rechten Seite die Größe der Schüler in inches darstellt.
In diesem Fall erstellen wir eine neue Achse, twin_axes, die die X-Achse mit axes teilt. Die Y-Achse von axes hat ihre Beschriftung auf Height in cms gesetzt, während die Y-Achse von twin_axes auf Height in Inches gesetzt ist.
matplotlib.axes.Axes.twiny() in Matplotlib Python
Die Funktion matplotlib.axes.Axes.twiny() erzeugt weitere Achsen in einer Matplotlib-Figur, die die gemeinsame Y-Achse mit den ersten Achsen teilen.
import matplotlib.pyplot as plt

distance_in_kms = [10, 20, 30, 40, 50]
fare_in_dollars = [2, 3.5, 5, 7, 10]

fig, axes = plt.subplots()
fig.set_size_inches(10, 8)
axes.plot(distance_in_kms, fare_in_dollars)
x1, x2 = axes.get_xlim()
axes.set_xlabel("Distance in kms", fontsize=12)
axes.set_ylabel("Fare ($)", fontsize=12)

twin_axes = axes.twiny()
twin_axes.set_xlim(x1 * 0.62, x2 * 0.62)
twin_axes.set_xlabel("Distance in miles", fontsize=12)

fig.suptitle("Plot using matplotlib.axes.Axes.twiny()", fontsize=15)
plt.show()
Ausgabe:
.webp)
Wir erstellen eine neue Achse, twin_axes, die sich die Y-Achse mit axes teilt. Die X-Achse von axes hat ihre Beschriftung auf Distance in kms gesetzt, während die X-Achse von twin_axes auf Distance in miles gesetzt ist.
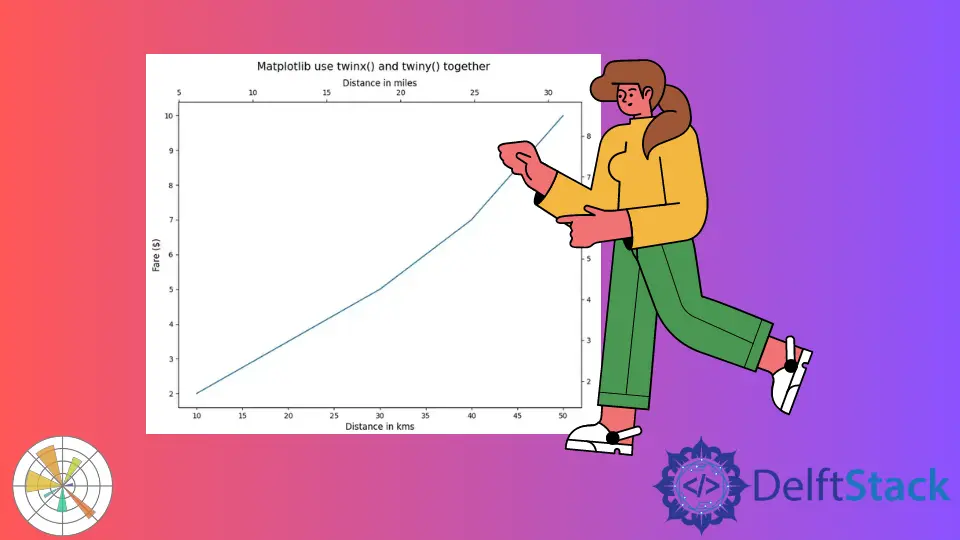
Matplotlib Verwenden Sie twinx() und twiny() zusammen
import matplotlib.pyplot as plt

distance_in_kms = [10, 20, 30, 40, 50]
fare_in_dollars = [2, 3.5, 5, 7, 10]

fig, axes = plt.subplots()
fig.set_size_inches(10, 8)
axes.plot(distance_in_kms, fare_in_dollars)
x1, x2 = axes.get_xlim()
y1, y2 = axes.get_ylim()
axes.set_xlabel("Distance in kms", fontsize=12)
axes.set_ylabel("Fare ($)", fontsize=12)

twin_axes = axes.twinx().twiny()

twin_axes.set_ylim(y1 * 0.85, y2 * 0.85)
twin_axes.set_ylabel("Fare in Euros", fontsize=12)

twin_axes.set_xlim(x1 * 0.62, x2 * 0.62)
twin_axes.set_xlabel("Distance in miles", fontsize=12)

fig.suptitle("Matplotlib use twinx() and twiny() together", fontsize=15)
plt.show()
Ausgabe:
-and-twiny()-together.webp)
Es wird eine Matplotlib-Figur mit Tickmarks auf allen Seiten der Figur erzeugt. Die axes steuern die linke X-Achse und die untere Y-Achse, während die twin_axes die rechte X-Achse und die obere Y-Achse steuern.

Suraj Joshi is a backend software engineer at Matrice.ai.
LinkedIn