如何在 Matplotlib 中改變子圖的大小和間距
Suraj Joshi
2023年1月30日
Matplotlib
Matplotlib Subplot
-
tight_layout()方法更改 Matplotlib 子圖大小和間距 -
plt.subplots_adjust()方法更改 Matplotlib 子圖間距 -
plt.subplot_tool()方法更改 Matplotlib 子圖大小和間距 -
在子圖中啟用
constrained_layout=True

我們可以使用 tight_layout(),subplots_adjust() 和 subplot_tool() 方法來更改 Matplotlib 中許多子圖的子圖大小或間距。我們還可以通過在 subplots() 函式中設定 constrained_layout=True 來更改子圖間距。
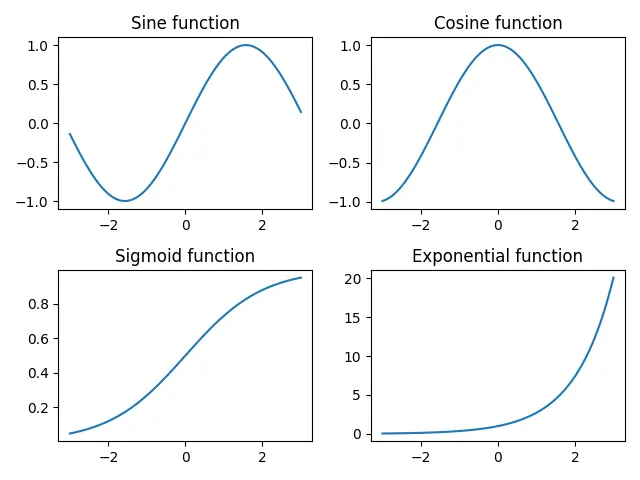
tight_layout() 方法更改 Matplotlib 子圖大小和間距
tight_layout() 方法會自動保持子圖之間的正確間距。
import numpy as np
import matplotlib.pyplot as plt

x = np.linspace(-3, 3, 100)
y1 = np.sin(x)
y2 = np.cos(x)
y3 = 1 / (1 + np.exp(-x))
y4 = np.exp(x)

fig, ax = plt.subplots(2, 2)

ax[0, 0].plot(x, y1)
ax[0, 1].plot(x, y2)
ax[1, 0].plot(x, y3)
ax[1, 1].plot(x, y4)

ax[0, 0].set_title("Sine function")
ax[0, 1].set_title("Cosine function")
ax[1, 0].set_title("Sigmoid function")
ax[1, 1].set_title("Exponential function")

fig.tight_layout()
plt.show()
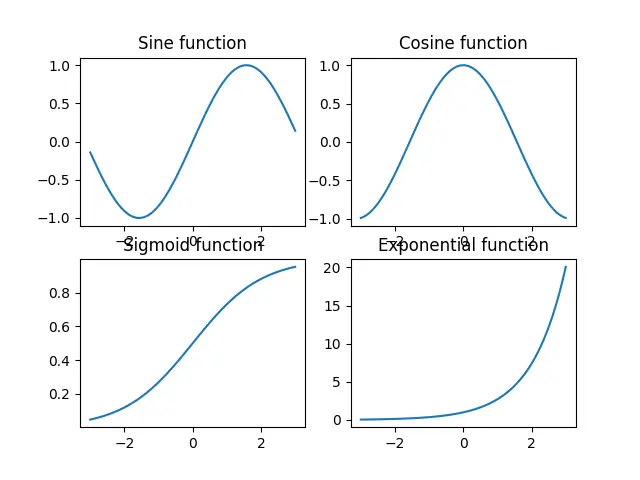
如果我們不使用 tight_layout() 方法,則一行將與下一行的標題重疊。
import numpy as np
import matplotlib.pyplot as plt

x = np.linspace(-3, 3, 100)
y1 = np.sin(x)
y2 = np.cos(x)
y3 = 1 / (1 + np.exp(-x))
y4 = np.exp(x)

fig, ax = plt.subplots(2, 2)

ax[0, 0].plot(x, y1)
ax[0, 1].plot(x, y2)
ax[1, 0].plot(x, y3)
ax[1, 1].plot(x, y4)

ax[0, 0].set_title("Sine function")
ax[0, 1].set_title("Cosine function")
ax[1, 0].set_title("Sigmoid function")
ax[1, 1].set_title("Exponential function")

plt.show()
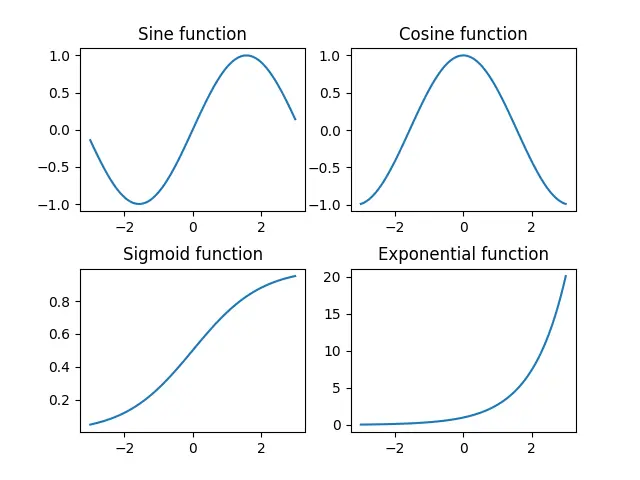
plt.subplots_adjust() 方法更改 Matplotlib 子圖間距
我們可以使用 plt.subplots_adjust() 方法來更改子圖之間的間距。
import numpy as np
import matplotlib.pyplot as plt

x = np.linspace(-3, 3, 100)
y1 = np.sin(x)
y2 = np.cos(x)
y3 = 1 / (1 + np.exp(-x))
y4 = np.exp(x)

fig, ax = plt.subplots(2, 2)

ax[0, 0].plot(x, y1)
ax[0, 1].plot(x, y2)
ax[1, 0].plot(x, y3)
ax[1, 1].plot(x, y4)

ax[0, 0].set_title("Sine function")
ax[0, 1].set_title("Cosine function")
ax[1, 0].set_title("Sigmoid function")
ax[1, 1].set_title("Exponential function")

plt.subplots_adjust(left=0.125, bottom=0.1, right=0.9, top=0.9, wspace=0.2, hspace=0.35)

plt.show()
plt.subplots_adjust(left=0.125, bottom=0.1, right=0.9, top=0.9, wspace=0.2, hspace=0.35)
wspace 和 hspace 指定子圖之間保留的空間。它們分別是軸的寬度和高度的分數。
left,right,top 和 bottom 引數指定了子圖的四個邊的位置。它們是圖形的寬度和高度的比例。
plt.subplot_tool() 方法更改 Matplotlib 子圖大小和間距
此方法將啟動圖形的子圖工具視窗。
import numpy as np
import matplotlib.pyplot as plt

im1 = np.random.random((50, 50))
im2 = np.random.random((40, 50))
im3 = np.random.random((50, 40))
im4 = np.random.random((60, 50))

plt.subplot(221)
plt.imshow(im1)
plt.subplot(222)
plt.imshow(im2)
plt.subplot(223)
plt.imshow(im3)
plt.subplot(224)
plt.imshow(im4)

plt.subplot_tool()
plt.show()
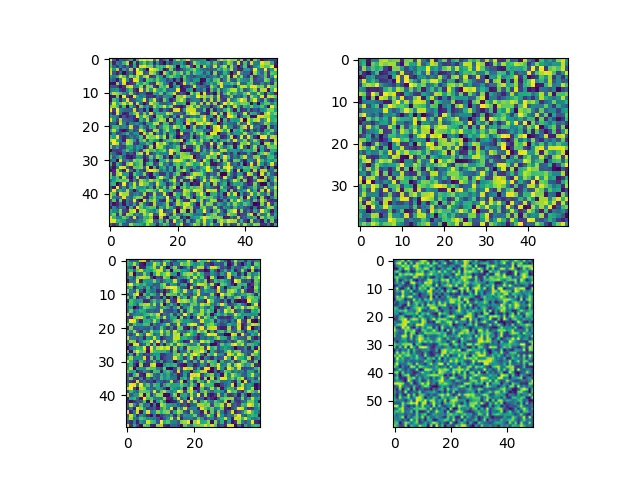
它為使用者提供了一種互動式方法來拖動 subplot_tool 中的條以更改子圖的佈局。
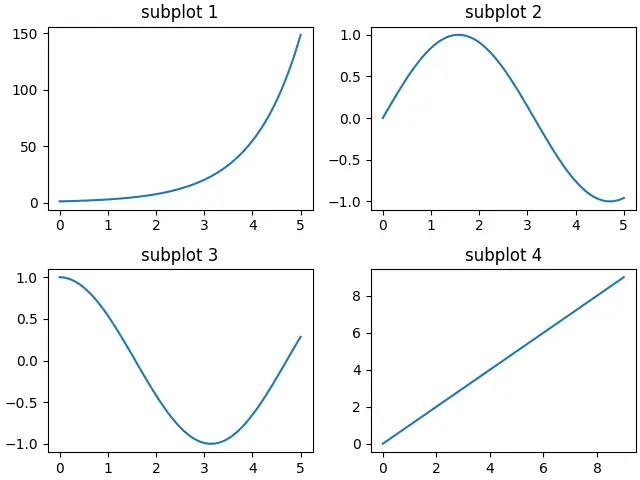
在子圖中啟用 constrained_layout=True
constrained_layout 會自動調整子圖和裝飾,使其儘可能地適合圖中。
必須在建立子圖之前或期間啟用 constrained_layout,因為它會在每個繪製步驟之前優化佈局。
import numpy as np
import matplotlib.pyplot as plt

a = np.linspace(0, 5, 100)

figure, axes = plt.subplots(2, 2, constrained_layout=True)

axes[0, 0].plot(x, np.exp(a))
axes[0, 1].plot(a, np.sin(a))
axes[1, 0].plot(a, np.cos(a))
axes[1, 1].plot(range(10))

axes[0, 0].set_title("subplot 1")
axes[0, 1].set_title("subplot 2")
axes[1, 0].set_title("subplot 3")
axes[1, 1].set_title("subplot 4")

plt.show()
Enjoying our tutorials? Subscribe to DelftStack on YouTube to support us in creating more high-quality video guides. Subscribe
作者: Suraj Joshi

Suraj Joshi is a backend software engineer at Matrice.ai.
LinkedIn