Matplotlib에서 여러 하위 플롯으로 하위 플롯 크기 또는 간격을 개선하는 방법
-
Matplotlib 서브 플롯 크기 및 간격을 변경하는
tight_layout()메소드 -
plt.subplots_adjust()메소드 -
plt.subplot_tool()메소드 -
서브 플로트 함수에서
constrained_layout=True활성화

Mattlotlib에서tight_layout(),subplots_adjust()및subplot_tool()메소드를 사용하여 서브 플롯 크기 또는 간격을 개선하기 위해 Matplotlib에서 서브 플롯 크기를 개선 할 수 있습니다. subplots() 함수에서constrained_layout=True를 설정하여 서브 플롯 간격을 개선 할 수도 있습니다.
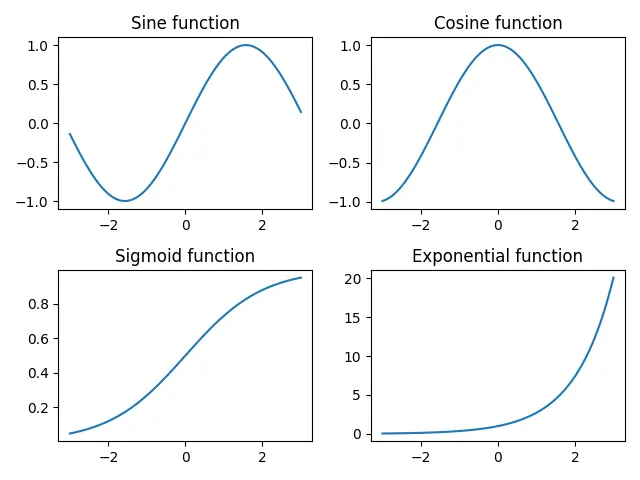
Matplotlib 서브 플롯 크기 및 간격을 변경하는tight_layout()메소드
tight_layout()메소드는 서브 플롯간에 올바른 간격을 자동으로 유지합니다.
import numpy as np
import matplotlib.pyplot as plt

x = np.linspace(-3, 3, 100)
y1 = np.sin(x)
y2 = np.cos(x)
y3 = 1 / (1 + np.exp(-x))
y4 = np.exp(x)

fig, ax = plt.subplots(2, 2)

ax[0, 0].plot(x, y1)
ax[0, 1].plot(x, y2)
ax[1, 0].plot(x, y3)
ax[1, 1].plot(x, y4)

ax[0, 0].set_title("Sine function")
ax[0, 1].set_title("Cosine function")
ax[1, 0].set_title("Sigmoid function")
ax[1, 1].set_title("Exponential function")

fig.tight_layout()
plt.show()
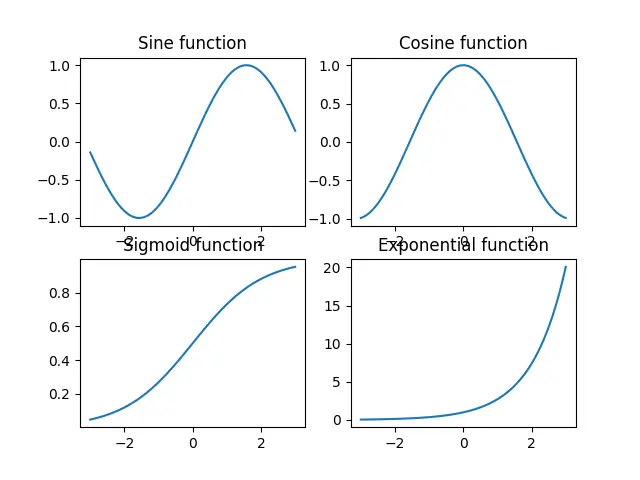
tight_layout()메소드를 사용하지 않으면 한 행이 다음 행의 제목과 겹칩니다.
import numpy as np
import matplotlib.pyplot as plt

x = np.linspace(-3, 3, 100)
y1 = np.sin(x)
y2 = np.cos(x)
y3 = 1 / (1 + np.exp(-x))
y4 = np.exp(x)

fig, ax = plt.subplots(2, 2)

ax[0, 0].plot(x, y1)
ax[0, 1].plot(x, y2)
ax[1, 0].plot(x, y3)
ax[1, 1].plot(x, y4)

ax[0, 0].set_title("Sine function")
ax[0, 1].set_title("Cosine function")
ax[1, 0].set_title("Sigmoid function")
ax[1, 1].set_title("Exponential function")

plt.show()
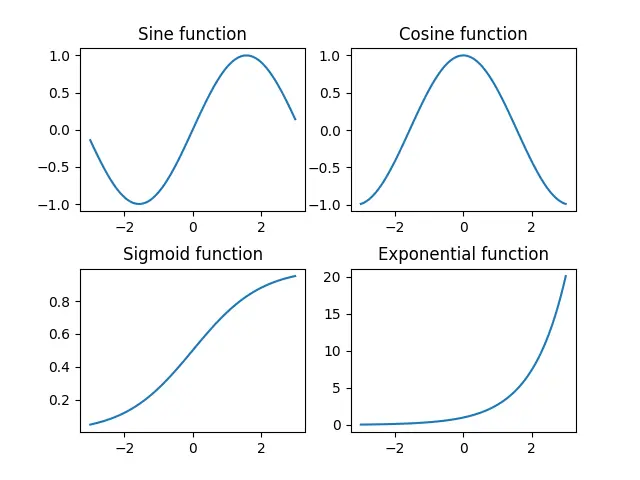
plt.subplots_adjust()메소드
plt.subplots_adjust()메소드를 사용하여 서브 플롯 간 간격을 변경할 수 있습니다.
import numpy as np
import matplotlib.pyplot as plt

x = np.linspace(-3, 3, 100)
y1 = np.sin(x)
y2 = np.cos(x)
y3 = 1 / (1 + np.exp(-x))
y4 = np.exp(x)

fig, ax = plt.subplots(2, 2)

ax[0, 0].plot(x, y1)
ax[0, 1].plot(x, y2)
ax[1, 0].plot(x, y3)
ax[1, 1].plot(x, y4)

ax[0, 0].set_title("Sine function")
ax[0, 1].set_title("Cosine function")
ax[1, 0].set_title("Sigmoid function")
ax[1, 1].set_title("Exponential function")

plt.subplots_adjust(left=0.125, bottom=0.1, right=0.9, top=0.9, wspace=0.2, hspace=0.35)

plt.show()
plt.subplots_adjust(left=0.125, bottom=0.1, right=0.9, top=0.9, wspace=0.2, hspace=0.35)
wspace와hspace는 서브 플롯 사이에 예약 된 공간을 지정합니다. 축 너비와 높이의 비율입니다.
left,right,top 및bottom 매개 변수는 서브 플롯의 4면 위치를 지정합니다. 그것들은 그림의 너비와 높이의 분수입니다.
plt.subplot_tool()메소드
이 방법은 그림에 대한 서브 플롯 도구 창을 시작합니다.
import numpy as np
import matplotlib.pyplot as plt

im1 = np.random.random((50, 50))
im2 = np.random.random((40, 50))
im3 = np.random.random((50, 40))
im4 = np.random.random((60, 50))

plt.subplot(221)
plt.imshow(im1)
plt.subplot(222)
plt.imshow(im2)
plt.subplot(223)
plt.imshow(im3)
plt.subplot(224)
plt.imshow(im4)

plt.subplot_tool()
plt.show()
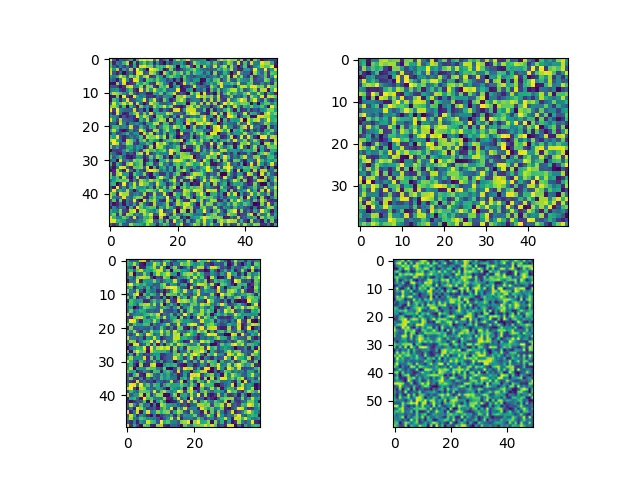
서브 플롯의 레이아웃을 변경하기 위해 subplot_tool의 막대를 드래그하는 대화식 방법을 제공합니다.
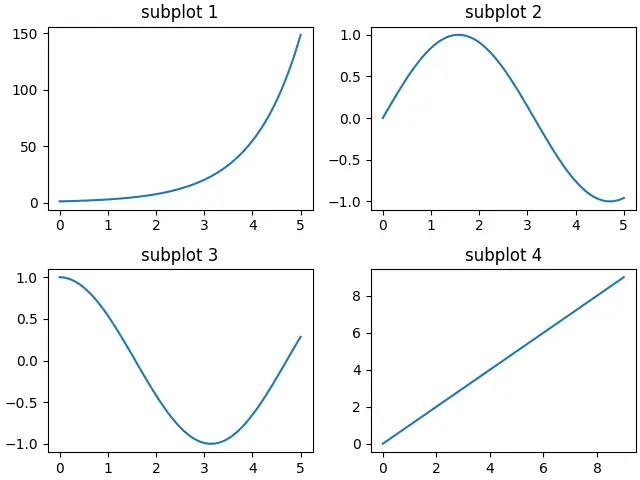
서브 플로트 함수에서constrained_layout=True 활성화
constrained_layout은 서브 플로트와 장식을 가능한 한 최적의 수치로 자동 조정합니다.
constrained_layout은 모든 플롯 단계 전에 레이아웃을 최적화하므로 서브 플롯 생성 전 또는 도중에 활성화되어야합니다.
import numpy as np
import matplotlib.pyplot as plt

a = np.linspace(0, 5, 100)

figure, axes = plt.subplots(2, 2, constrained_layout=True)

axes[0, 0].plot(x, np.exp(a))
axes[0, 1].plot(a, np.sin(a))
axes[1, 0].plot(a, np.cos(a))
axes[1, 1].plot(range(10))

axes[0, 0].set_title("subplot 1")
axes[0, 1].set_title("subplot 2")
axes[1, 0].set_title("subplot 3")
axes[1, 1].set_title("subplot 4")

plt.show()

Suraj Joshi is a backend software engineer at Matrice.ai.
LinkedIn