Matplotlib에서 서브 플롯에 제목을 추가하는 방법
Suraj Joshi
2023년1월30일
Matplotlib
Matplotlib Subplot
-
Matplotlib에서 서브 플롯에 타이틀을 추가하는
Set_title()메소드 -
Matplotlib에서 서브 플로트의 제목을 설정하는
title.set_text()메소드 -
Matplotlib에서 제목을 서브 플롯으로 설정하는
plt.gca().set_title()/plt.gca.title.set_text()
우리는set_title(label)및title.set_text(label)메소드를 사용하여 Matplotlib의 서브 플롯에 제목을 추가합니다.
Matplotlib에서 서브 플롯에 타이틀을 추가하는Set_title()메소드
matplotlib.axes._axes.Axes.set_title(label) 메소드를 사용하여 현재 서브 플롯Axes의 제목 (문자열label)을 설정합니다.
import numpy as np
import matplotlib.pyplot as plt
x = np.linspace(-3, 3, 100)
y1 = np.sin(x)
y2 = np.cos(x)
y3 = 1 / (1 + np.exp(-x))
y4 = np.exp(x)
fig, ax = plt.subplots(2, 2)
ax[0, 0].plot(x, y1)
ax[0, 1].plot(x, y2)
ax[1, 0].plot(x, y3)
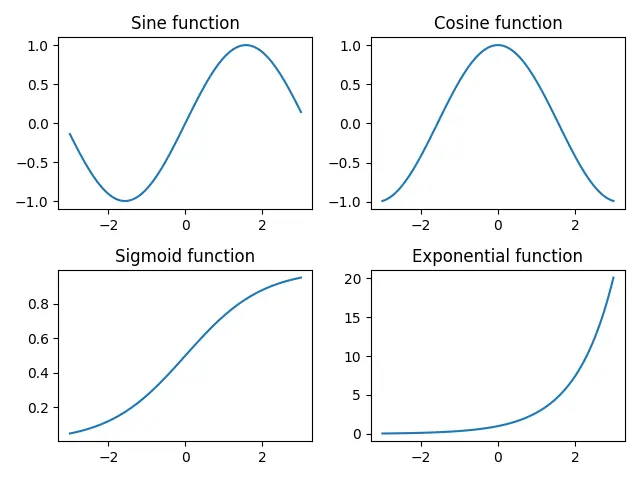
ax[1, 1].plot(x, y4)
ax[0, 0].set_title("Sine function")
ax[0, 1].set_title("Cosine function")
ax[1, 0].set_title("Sigmoid function")
ax[1, 1].set_title("Exponential function")
fig.tight_layout()
plt.show()
출력:
일부 서브 플롯을 반복하고 제목과 함께 한 번에 하나씩 표시하려면 다음 짧은 코드를 사용할 수 있습니다.
import numpy as np
import matplotlib.pyplot as plt

x = np.linspace(-3, 3, 100)
y = [0, 0, 0, 0]
y[0] = np.sin(x)
y[1] = np.cos(x)
y[2] = 1 / (1 + np.exp(-x))
y[3] = np.exp(x)

figure, ax = plt.subplots(2, 2)
i = 0
for a in range(len(ax)):
    for b in range(len(ax[a])):
        ax[a, b].plot(x, y[i])
        subplot_title = "Subplot" + str(i)
        ax[a, b].set_title(subplot_title)
        i = i + 1

figure.tight_layout()
plt.show()
출력:

Matplotlib에서 서브 플로트의 제목을 설정하는title.set_text()메소드
set_title()메소드와 비슷한 방법으로 title.set_text()메소드를 사용하여 Matplotlib의 서브 플롯에 제목을 추가 할 수도 있습니다.
import numpy as np
import matplotlib.pyplot as plt

x = np.linspace(-3, 3, 100)
y1 = np.sin(x)
y2 = np.cos(x)
y3 = 1 / (1 + np.exp(-x))
y4 = np.exp(x)

fig, ax = plt.subplots(2, 2)

ax[0, 0].plot(x, y1)
ax[0, 1].plot(x, y2)
ax[1, 0].plot(x, y3)
ax[1, 1].plot(x, y4)

ax[0, 0].title.set_text("Sine function")
ax[0, 1].title.set_text("Cosine function")
ax[1, 0].title.set_text("Sigmoid function")
ax[1, 1].title.set_text("Exponential function")

fig.tight_layout()
plt.show()
출력:

Matplotlib에서 제목을 서브 플롯으로 설정하는plt.gca().set_title()/plt.gca.title.set_text()
대화식 플로팅에서 Matlab과 같은 스타일을 사용하는 경우plt.gca()를 사용하여 서브 플롯의 현재 축에 대한 참조를 가져오고set_title()또는title.set_text()메소드를 결합 할 수 있습니다 Matplotlib에서 제목을 서브 플로트로 설정합니다.
import matplotlib.pyplot as plt

plt.subplots(2, 2)
x = [1, 2, 3]
y = [2, 4, 6]


for i in range(4):
    plt.subplot(2, 2, i + 1)
    plt.plot(x, y)
    plt.gca().set_title("Title-" + str(i))

plt.show()

plt.tight_layout()
또는,
import matplotlib.pyplot as plt

plt.subplots(2, 2)
x = [1, 2, 3]
y = [2, 4, 6]


for i in range(4):
    plt.subplot(2, 2, i + 1)
    plt.plot(x, y)
    plt.gca().title.set_text("Title-" + str(i))

plt.show()

plt.tight_layout()
튜토리얼이 마음에 드시나요? DelftStack을 구독하세요 YouTube에서 저희가 더 많은 고품질 비디오 가이드를 제작할 수 있도록 지원해주세요. 구독하다
작가: Suraj Joshi

Suraj Joshi is a backend software engineer at Matrice.ai.
LinkedIn