Wie man Subplots in Matplotlib einen Titel hinzufügt
-
Set_title()Methode zum Hinzufügen von Titeln zu Unterhandlungen in der Matplotlib -
title.set_text()Methode zum Setzen des Titels von Unterplots in Matplotlib -
plt.gca().set_title()/plt.gca.title.set_text()zum Setzen von Titeln für Unterhandlungen in der Matplotlib
Wir verwenden die Methoden set_title(label) und title.set_text(label), um Titel zu Subplots in der Matplotlib hinzuzufügen.
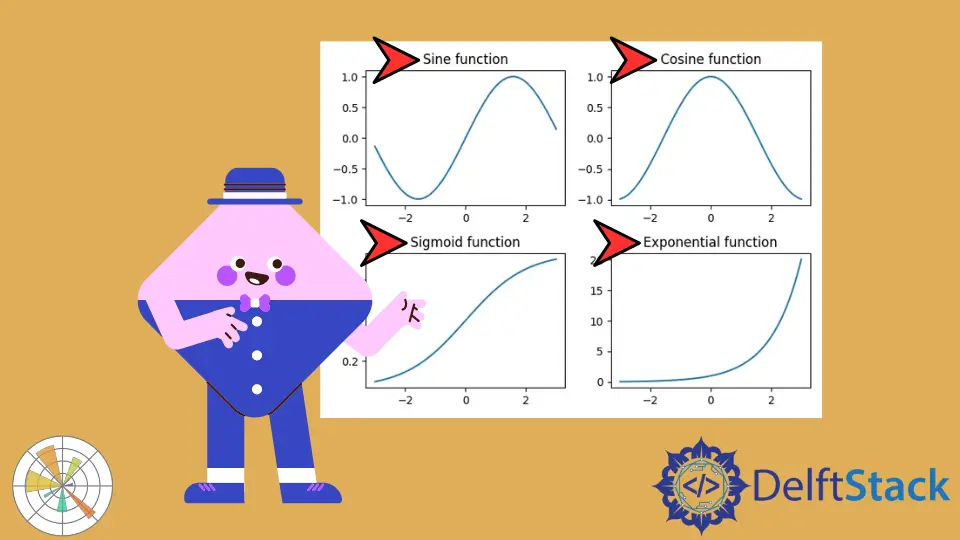
Set_title() Methode zum Hinzufügen von Titeln zu Unterhandlungen in der Matplotlib
Wir verwenden die Methode matplotlib.axes._axes.Axes.set_title(label), um den Titel (String label) für den aktuellen Subplot Axes zu setzen.
import numpy as np
import matplotlib.pyplot as plt
x = np.linspace(-3, 3, 100)
y1 = np.sin(x)
y2 = np.cos(x)
y3 = 1 / (1 + np.exp(-x))
y4 = np.exp(x)
fig, ax = plt.subplots(2, 2)
ax[0, 0].plot(x, y1)
ax[0, 1].plot(x, y2)
ax[1, 0].plot(x, y3)
ax[1, 1].plot(x, y4)
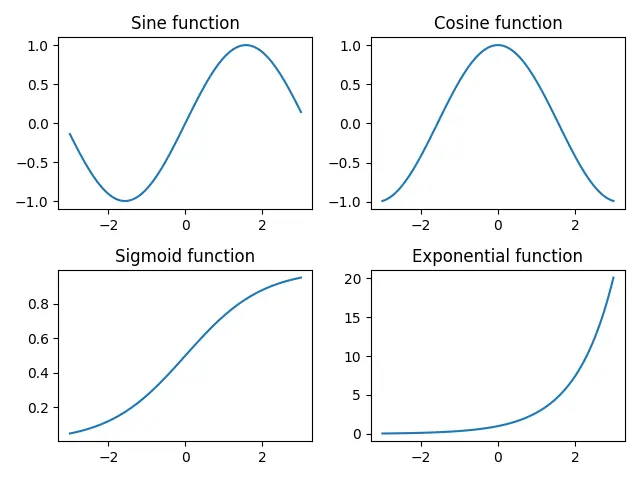
ax[0, 0].set_title("Sine function")
ax[0, 1].set_title("Cosine function")
ax[1, 0].set_title("Sigmoid function")
ax[1, 1].set_title("Exponential function")
fig.tight_layout()
plt.show()
Ausgabe:
Wenn wir eine Schleife über einige Nebenhandlungen drehen und sie nacheinander zusammen mit Titeln zeigen wollen, können wir den folgenden kürzeren Code verwenden:
import numpy as np
import matplotlib.pyplot as plt

x = np.linspace(-3, 3, 100)
y = [0, 0, 0, 0]
y[0] = np.sin(x)
y[1] = np.cos(x)
y[2] = 1 / (1 + np.exp(-x))
y[3] = np.exp(x)

figure, ax = plt.subplots(2, 2)
i = 0
for a in range(len(ax)):
    for b in range(len(ax[a])):
        ax[a, b].plot(x, y[i])
        subplot_title = "Subplot" + str(i)
        ax[a, b].set_title(subplot_title)
        i = i + 1

figure.tight_layout()
plt.show()
Ausgabe:

title.set_text() Methode zum Setzen des Titels von Unterplots in Matplotlib
Wir können Subplots in Matplotlib auch Titel hinzufügen, indem wir die Methode title.set_text() verwenden, ähnlich der Methode set_title().
import numpy as np
import matplotlib.pyplot as plt

x = np.linspace(-3, 3, 100)
y1 = np.sin(x)
y2 = np.cos(x)
y3 = 1 / (1 + np.exp(-x))
y4 = np.exp(x)

fig, ax = plt.subplots(2, 2)

ax[0, 0].plot(x, y1)
ax[0, 1].plot(x, y2)
ax[1, 0].plot(x, y3)
ax[1, 1].plot(x, y4)

ax[0, 0].title.set_text("Sine function")
ax[0, 1].title.set_text("Cosine function")
ax[1, 0].title.set_text("Sigmoid function")
ax[1, 1].title.set_text("Exponential function")

fig.tight_layout()
plt.show()
Ausgabe:

plt.gca().set_title() / plt.gca.title.set_text() zum Setzen von Titeln für Unterhandlungen in der Matplotlib
Wenn Sie beim interaktiven Plotten einen Matlab-ähnlichen Stil verwenden, dann könnten Sie plt.gca() verwenden, um die Referenz der aktuellen Achsen des Unterplotts zu erhalten und die Methode set_title() oder title.set_text() kombinieren, um den Titel der Unterplotts in der Matplotlib zu setzen.
import matplotlib.pyplot as plt

plt.subplots(2, 2)
x = [1, 2, 3]
y = [2, 4, 6]


for i in range(4):
    plt.subplot(2, 2, i + 1)
    plt.plot(x, y)
    plt.gca().set_title("Title-" + str(i))

plt.show()

plt.tight_layout()
oder,
import matplotlib.pyplot as plt

plt.subplots(2, 2)
x = [1, 2, 3]
y = [2, 4, 6]


for i in range(4):
    plt.subplot(2, 2, i + 1)
    plt.plot(x, y)
    plt.gca().title.set_text("Title-" + str(i))

plt.show()

plt.tight_layout()

Suraj Joshi is a backend software engineer at Matrice.ai.
LinkedIn