如何在 Matplotlib 中向子图添加标题
Suraj Joshi
2023年1月30日
Matplotlib
Matplotlib Subplot
- 使用 set_title()方法将标题添加到 Matplotlib 中的子图
-
使用
title.set_text()方法设置 Matplotlib 子图的标题 -
plt.gca().set_title()/plt.gca.title.set_text()将标题设置为 Matplotlib 中的子图
我们使用 set_title(label) 和 title.set_text(label) 方法将标题添加到 Matplotlib 中的子图中。
使用 set_title()方法将标题添加到 Matplotlib 中的子图
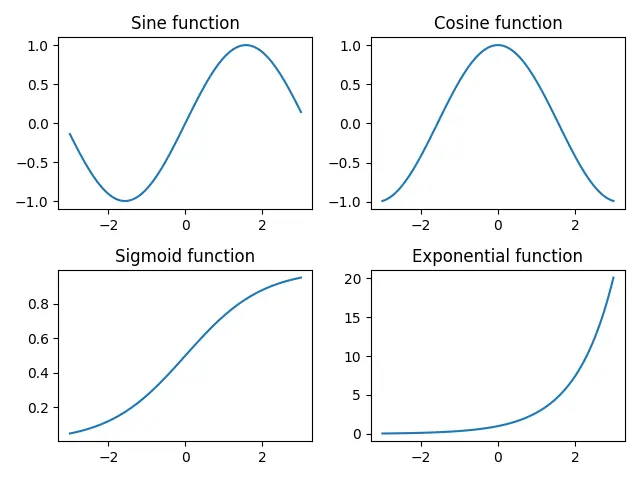
我们使用 matplotlib.axes._axes.Axes.set_title(label) 方法来设置当前子图 Axes 的标题(字符串 label)。
import numpy as np
import matplotlib.pyplot as plt

x = np.linspace(-3, 3, 100)
y1 = np.sin(x)
y2 = np.cos(x)
y3 = 1 / (1 + np.exp(-x))
y4 = np.exp(x)

fig, ax = plt.subplots(2, 2)

ax[0, 0].plot(x, y1)
ax[0, 1].plot(x, y2)
ax[1, 0].plot(x, y3)
ax[1, 1].plot(x, y4)

ax[0, 0].set_title("Sine function")
ax[0, 1].set_title("Cosine function")
ax[1, 0].set_title("Sigmoid function")
ax[1, 1].set_title("Exponential function")

fig.tight_layout()
plt.show()
输出:
如果我们要遍历某些子图并一次显示一个子图和标题,则可以使用以下较短的代码:
import numpy as np
import matplotlib.pyplot as plt

x = np.linspace(-3, 3, 100)
y = [0, 0, 0, 0]
y[0] = np.sin(x)
y[1] = np.cos(x)
y[2] = 1 / (1 + np.exp(-x))
y[3] = np.exp(x)

figure, ax = plt.subplots(2, 2)
i = 0
for a in range(len(ax)):
    for b in range(len(ax[a])):
        ax[a, b].plot(x, y[i])
        subplot_title = "Subplot" + str(i)
        ax[a, b].set_title(subplot_title)
        i = i + 1

figure.tight_layout()
plt.show()
输出:

使用 title.set_text() 方法设置 Matplotlib 子图的标题
我们也可以使用 title.set_text() 方法将标题添加到 Matplotlib 中的子图中,类似于 set_title() 方法。
import numpy as np
import matplotlib.pyplot as plt

x = np.linspace(-3, 3, 100)
y1 = np.sin(x)
y2 = np.cos(x)
y3 = 1 / (1 + np.exp(-x))
y4 = np.exp(x)

fig, ax = plt.subplots(2, 2)

ax[0, 0].plot(x, y1)
ax[0, 1].plot(x, y2)
ax[1, 0].plot(x, y3)
ax[1, 1].plot(x, y4)

ax[0, 0].title.set_text("Sine function")
ax[0, 1].title.set_text("Cosine function")
ax[1, 0].title.set_text("Sigmoid function")
ax[1, 1].title.set_text("Exponential function")

fig.tight_layout()
plt.show()
输出:

plt.gca().set_title() / plt.gca.title.set_text() 将标题设置为 Matplotlib 中的子图
如果在交互式绘图中使用类似 Matlab 的样式,则可以使用 plt.gca() 来获得子图的当前轴的参考,并结合使用 set_title() 或 title.set_text() 方法为 Matplotlib 中的子图设置标题。
import matplotlib.pyplot as plt

plt.subplots(2, 2)
x = [1, 2, 3]
y = [2, 4, 6]

for i in range(4):
    plt.subplot(2, 2, i + 1)
    plt.plot(x, y)
    plt.gca().set_title("Title-" + str(i))

plt.show()

plt.tight_layout()
要么,
import matplotlib.pyplot as plt

plt.subplots(2, 2)
x = [1, 2, 3]
y = [2, 4, 6]

for i in range(4):
    plt.subplot(2, 2, i + 1)
    plt.plot(x, y)
    plt.gca().title.set_text("Title-" + str(i))

plt.show()

plt.tight_layout()
Enjoying our tutorials? Subscribe to DelftStack on YouTube to support us in creating more high-quality video guides. Subscribe
作者: Suraj Joshi

Suraj Joshi is a backend software engineer at Matrice.ai.
LinkedIn