How to Change Space Between Subplots in Matplotlib
-
tight_layout()Method to Change Matplotlib Space Between Subplots -
plt.subplots_adjust()Method to Change Space Between Subplots in Matplotlib -
plt.subplot_tool()Method to Change Space Between Subplots in Matplotlib -
Activate
constrained_layout=Truein MatplotlibsubplotsFunction

We could use tight_layout(), subplots_adjust() and subplot_tool() methods to change subplot size or space in Matplotlib. We can also improve space between Matplotlib space by setting constrained_layout=True in the subplots() function.
tight_layout() Method to Change Matplotlib Space Between Subplots
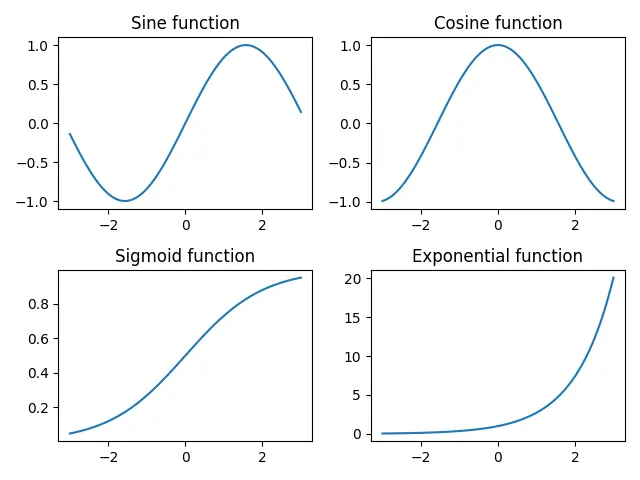
The tight_layout() method automatically maintains the proper space between subplots.
import numpy as np
import matplotlib.pyplot as plt

x = np.linspace(-3, 3, 100)
y1 = np.sin(x)
y2 = np.cos(x)
y3 = 1 / (1 + np.exp(-x))
y4 = np.exp(x)

fig, ax = plt.subplots(2, 2)

ax[0, 0].plot(x, y1)
ax[0, 1].plot(x, y2)
ax[1, 0].plot(x, y3)
ax[1, 1].plot(x, y4)

ax[0, 0].set_title("Sine function")
ax[0, 1].set_title("Cosine function")
ax[1, 0].set_title("Sigmoid function")
ax[1, 1].set_title("Exponential function")

fig.tight_layout()
plt.show()
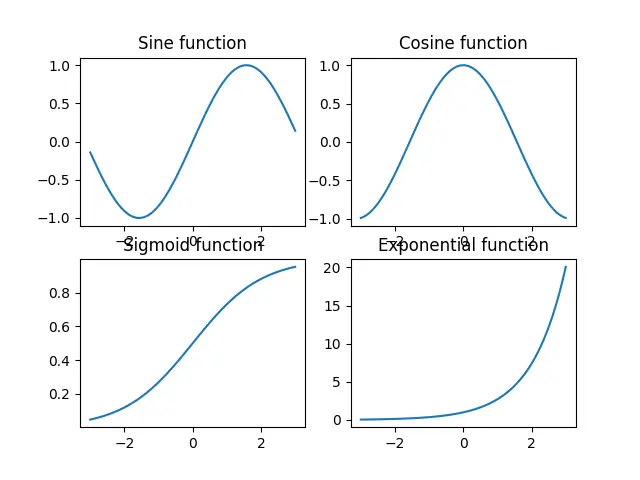
If we didn’t use the tight_layout() method, one row would overlap with the title of the next.
import numpy as np
import matplotlib.pyplot as plt

x = np.linspace(-3, 3, 100)
y1 = np.sin(x)
y2 = np.cos(x)
y3 = 1 / (1 + np.exp(-x))
y4 = np.exp(x)

fig, ax = plt.subplots(2, 2)

ax[0, 0].plot(x, y1)
ax[0, 1].plot(x, y2)
ax[1, 0].plot(x, y3)
ax[1, 1].plot(x, y4)

ax[0, 0].set_title("Sine function")
ax[0, 1].set_title("Cosine function")
ax[1, 0].set_title("Sigmoid function")
ax[1, 1].set_title("Exponential function")

plt.show()
plt.subplots_adjust() Method to Change Space Between Subplots in Matplotlib
We can use the plt.subplots_adjust() method to change the space between Matplotlib subplots.
import numpy as np
import matplotlib.pyplot as plt

x = np.linspace(-3, 3, 100)
y1 = np.sin(x)
y2 = np.cos(x)
y3 = 1 / (1 + np.exp(-x))
y4 = np.exp(x)

fig, ax = plt.subplots(2, 2)

ax[0, 0].plot(x, y1)
ax[0, 1].plot(x, y2)
ax[1, 0].plot(x, y3)
ax[1, 1].plot(x, y4)

ax[0, 0].set_title("Sine function")
ax[0, 1].set_title("Cosine function")
ax[1, 0].set_title("Sigmoid function")
ax[1, 1].set_title("Exponential function")

plt.subplots_adjust(left=0.125, bottom=0.1, right=0.9, top=0.9, wspace=0.2, hspace=0.35)

plt.show()
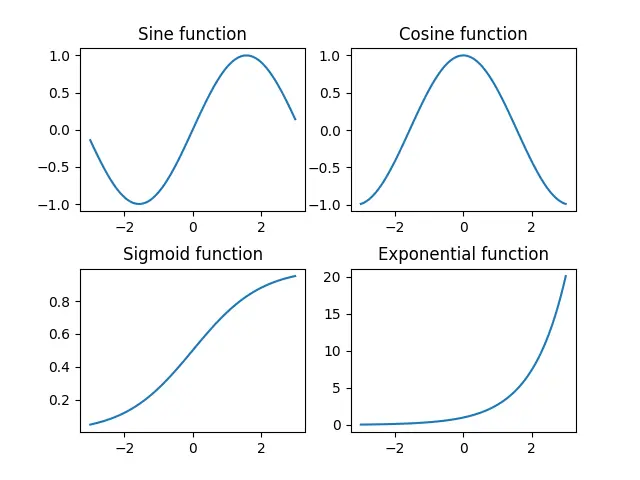
plt.subplots_adjust(left=0.125, bottom=0.1, right=0.9, top=0.9, wspace=0.2, hspace=0.35)
wspace and hspace specify the space reserved between Matplotlib subplots. They are the fractions of axis width and height, respectively.
left, right, top and bottom parameters specify four sides of the subplots’ positions. They are the fractions of the width and height of the figure.
plt.subplot_tool() Method to Change Space Between Subplots in Matplotlib
This method launches a subplot tool window for a figure.
import numpy as np
import matplotlib.pyplot as plt

im1 = np.random.random((50, 50))
im2 = np.random.random((40, 50))
im3 = np.random.random((50, 40))
im4 = np.random.random((60, 50))

plt.subplot(221)
plt.imshow(im1)
plt.subplot(222)
plt.imshow(im2)
plt.subplot(223)
plt.imshow(im3)
plt.subplot(224)
plt.imshow(im4)

plt.subplot_tool()
plt.show()
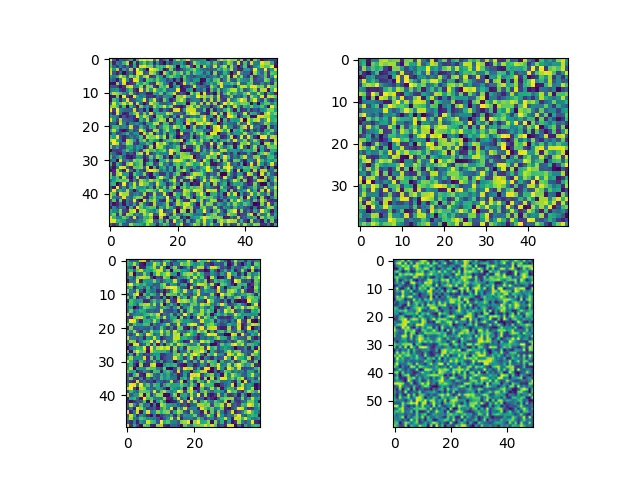
It provides an interactive method for the user to drag the bar in the subplot_tool to change the subplots’ layout.
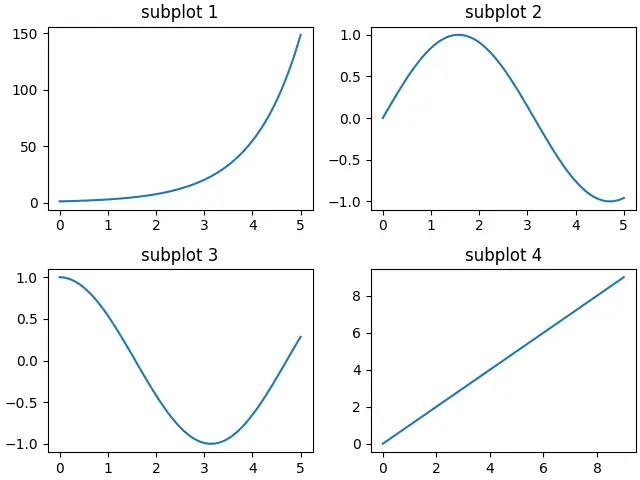
Activate constrained_layout=True in Matplotlib subplots Function
constrained_layout adjusts subplots and decorations automatically to fit them in the figure as best as possible.
constrained_layout must be activated before or during subplot creation as it optimizes the layout before every drawing step.
import numpy as np
import matplotlib.pyplot as plt

a = np.linspace(0, 5, 100)

figure, axes = plt.subplots(2, 2, constrained_layout=True)

axes[0, 0].plot(x, np.exp(a))
axes[0, 1].plot(a, np.sin(a))
axes[1, 0].plot(a, np.cos(a))
axes[1, 1].plot(range(10))

axes[0, 0].set_title("subplot 1")
axes[0, 1].set_title("subplot 2")
axes[1, 0].set_title("subplot 3")
axes[1, 1].set_title("subplot 4")

plt.show()

Suraj Joshi is a backend software engineer at Matrice.ai.
LinkedIn