How to Add Subplot to a Figure in Matplotlib
-
Add Subplot to a Figure Using the
matplotlib.pyplot.figure.add_subplot()Method -
Create Figure With Subplots Using
Matplotlib.pyplot.subplots()
This tutorial explains how we can add subplots to a Matplotlib figure using the matplotlib.pyplot.figure.add_subplot() method in Python.
Add Subplot to a Figure Using the matplotlib.pyplot.figure.add_subplot() Method
import matplotlib.pyplot as plt

fig = plt.figure(figsize=(5, 5))

x = [1, 2, 3, 4, 5]
y = [2, 4, 5, 1, 2]

subplot = fig.add_subplot(1, 1, 1)
subplot.plot(x, y)

fig.suptitle("Figure with only one Subplot")
plt.show()
Output:
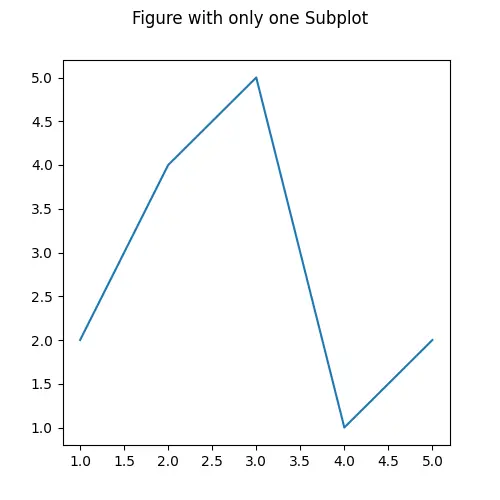
It generates a figure with only one subplot. The figure can be interpreted as a high-level element containing all the subplots and other elements in the figure. We first initialize the figure object of size (5,5) and then add a subplot to the figure using the add_subplot() method. The 1st argument to the add_subplot() method represents the number of subplot rows in the figure, the second argument represents the number of subplot columns, and the third argument represents the position of a subplot in the grid.
Here, fig.add_subplot(1,1,1) will add a subplot at first position to the 1 X 1 grid in the figure. Alternatively, we can also use fig.add_subplot(111) to achieve the same result. The add_subplot() method returns a axes object, which can be used to plot and add details to the subplot added.
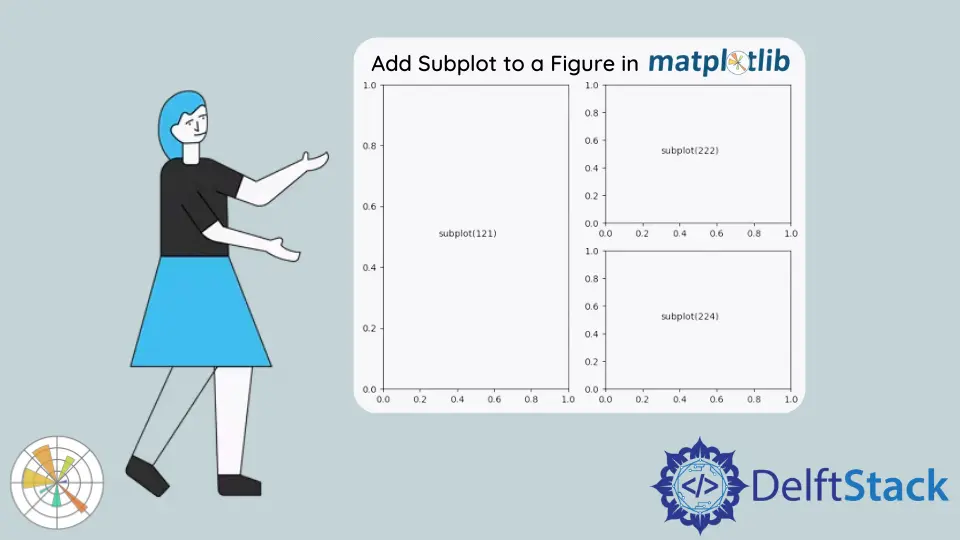
import matplotlib.pyplot as plt

fig = plt.figure(figsize=(8, 6))

ax_1 = fig.add_subplot(121)
ax_1.text(0.3, 0.5, "subplot(121)")

ax_2 = fig.add_subplot(222)
ax_2.text(0.3, 0.5, "subplot(222)")

ax_3 = fig.add_subplot(224)
ax_3.text(0.3, 0.5, "subplot(224)")

fig.suptitle("Figure with multiple Subplots")
plt.show()
Output:

Here, we have a figure with three subplots. The first subplot is the 1st figure in the grid with one row and two columns. The second subplot represents the second figure in the grid with two rows and two columns. Similarly, the third row represents the subplot at the fourth position in the grid with two rows and two columns.
Create Figure With Subplots Using Matplotlib.pyplot.subplots()
The Matplotlib.pyplot.subplots() also adds subplots to the figure. We pass the number of rows and columns as an argument to the method, and the method returns a figure object and axes object, which can be used to manipulate the plot.
import matplotlib.pyplot as plt

fig, ax = plt.subplots(2, 1)

ax[0].text(0.3, 0.5, "1st Subplot")
ax[0].set_xticks([])
ax[0].set_yticks([])

ax[1].text(0.3, 0.5, "2nd Subplot")
ax[1].set_xticks([])
ax[1].set_yticks([])

fig.suptitle("Figure with 2 subplots", fontsize=16)
plt.show()
Output:
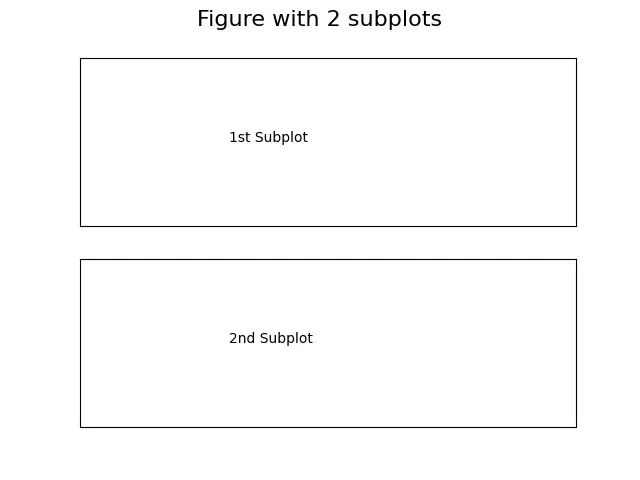
It generates a figure with two subplots in a grid of two rows and a single column using the subplots() method. The 1st subplot or the axes at the top can be manipulated with the first element in the ax list, and the second subplot or axes at the bottom can be manipulated with 2nd element in the ax list.
import matplotlib.pyplot as plt

x = [1, 2, 3, 4, 5]
y1 = [i ** 2 for i in x]
y2 = [4 * i + 1 for i in x]

fig, ax = plt.subplots(2, 1)

ax[0].plot(x, y1)
ax[0].set_xlabel("X")
ax[0].set_ylabel("Y")

ax[1].plot(x, y2)
ax[1].set_xlabel("X")
ax[1].set_ylabel("Y")

plt.tight_layout()
plt.show()
Output:
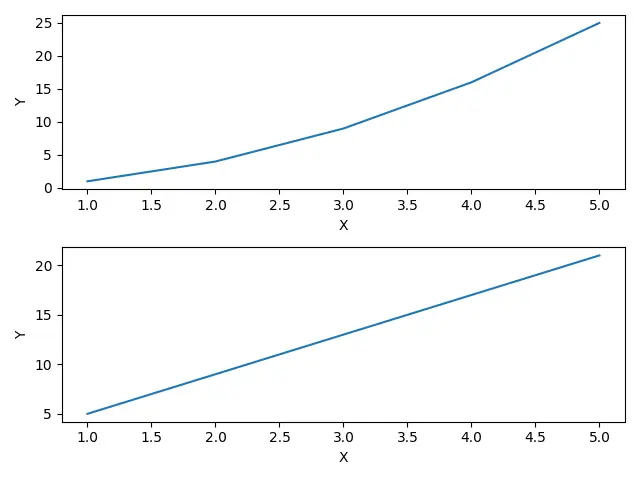
It generates a figure with two subplots, plots the x^2 function in the top subplot, and plots the 4x+1 function in the bottom subplot.

Suraj Joshi is a backend software engineer at Matrice.ai.
LinkedIn