在 Matplotlib 中新增子圖
本教程介紹瞭如何使用 Python 中的 matplotlib.pyplot.figure.add_subplot() 方法為 Matplotlib 圖新增子圖。
使用 matplotlib.pyplot.figure.add_subplot() 方法在圖中新增子圖
import matplotlib.pyplot as plt

fig = plt.figure(figsize=(5, 5))

x = [1, 2, 3, 4, 5]
y = [2, 4, 5, 1, 2]

subplot = fig.add_subplot(1, 1, 1)
subplot.plot(x, y)

fig.suptitle("Figure with only one Subplot")
plt.show()
輸出:
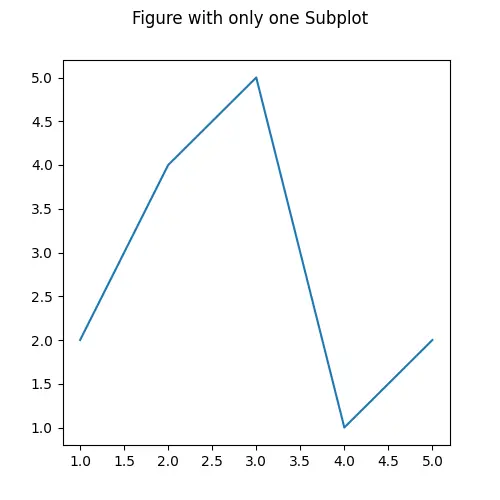
它生成的圖中只有一個子圖。該圖可以解釋為一個包含所有子圖和圖中其他元素的高階元素。我們首先初始化大小為 (5,5) 的圖物件,然後使用 add_subplot() 方法向圖中新增一個子圖。add_subplot() 方法的第 1 個引數代表圖中子圖的行數,第 2 個引數代表子圖的列數,第 3 個引數代表子圖在網格中的位置。
這裡,fig.add_subplot(1,1,1) 將在圖中 1 X 1 網格的第一個位置新增一個子圖。另外,我們也可以使用 fig.add_subplot(111) 來實現同樣的結果。add_subplot() 方法返回一個 axes 物件,它可以用來繪製和新增子圖的細節。
import matplotlib.pyplot as plt

fig = plt.figure(figsize=(8, 6))

ax_1 = fig.add_subplot(121)
ax_1.text(0.3, 0.5, "subplot(121)")

ax_2 = fig.add_subplot(222)
ax_2.text(0.3, 0.5, "subplot(222)")

ax_3 = fig.add_subplot(224)
ax_3.text(0.3, 0.5, "subplot(224)")

fig.suptitle("Figure with multiple Subplots")
plt.show()
輸出:

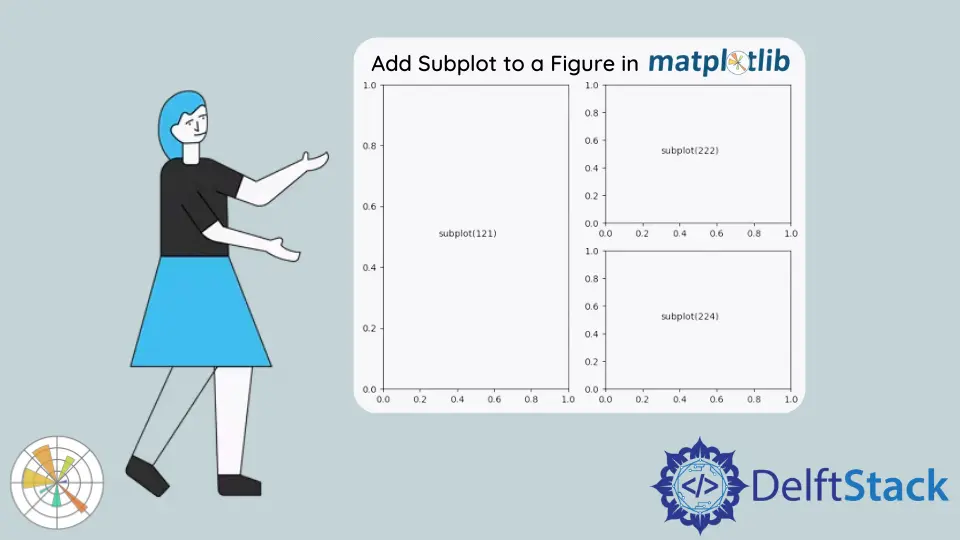
這裡,我們有一個包含三個子圖的圖。第一個子圖是網格中的第 1 個數字,有 1 行 2 列。第 2 個子圖代表網格中的第 2 個數字,有兩行兩列。同樣,第三行代表網格中第四個位置的子圖,有兩行兩列。
使用 Matplotlib.pyplot.subplots() 建立帶有子圖的圖
Matplotlib.pyplot.subplots() 也可以給圖新增子圖。我們將行數和列數作為引數傳遞給該方法,該方法返回一個圖物件和軸物件,可以用來操作圖形。
import matplotlib.pyplot as plt

fig, ax = plt.subplots(2, 1)

ax[0].text(0.3, 0.5, "1st Subplot")
ax[0].set_xticks([])
ax[0].set_yticks([])

ax[1].text(0.3, 0.5, "2nd Subplot")
ax[1].set_xticks([])
ax[1].set_yticks([])

fig.suptitle("Figure with 2 subplots", fontsize=16)
plt.show()
輸出:
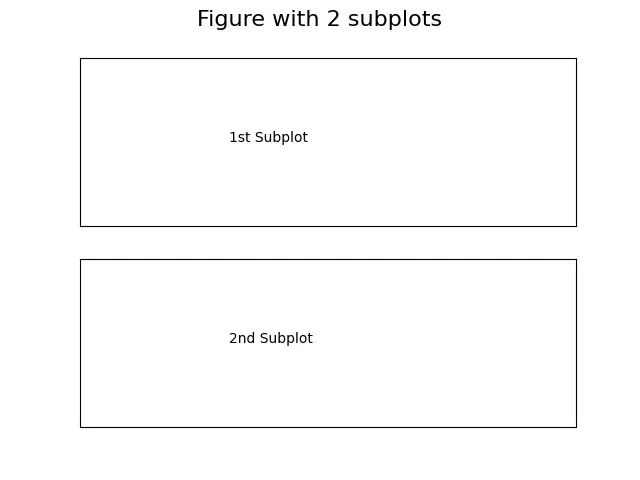
它使用 subplots() 方法在兩行一列的網格中生成一個有兩個子圖的圖形。第 1 個子圖或頂部的軸可以用 ax 列表中的第 1 個元素進行操作,第 2 個子圖或底部的軸可以用 ax 列表中的第 2 個元素進行操作。
import matplotlib.pyplot as plt

x = [1, 2, 3, 4, 5]
y1 = [i ** 2 for i in x]
y2 = [4 * i + 1 for i in x]

fig, ax = plt.subplots(2, 1)

ax[0].plot(x, y1)
ax[0].set_xlabel("X")
ax[0].set_ylabel("Y")

ax[1].plot(x, y2)
ax[1].set_xlabel("X")
ax[1].set_ylabel("Y")

plt.tight_layout()
plt.show()
輸出:
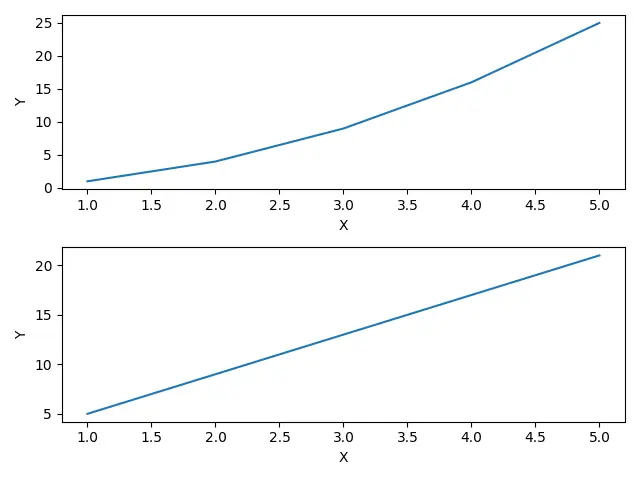
它生成一個有兩個子圖的圖形,在上面的子圖中繪製 x^2 函式,在下面的子圖中繪製 4x+1 函式。

Suraj Joshi is a backend software engineer at Matrice.ai.
LinkedIn