使用 Matplotlib 建立多個子圖
如果你想要額外的繪圖或使用更多物件導向的繪圖,最好使用 subplots 方法建立繪圖。許多人更喜歡以這種方式建立他們的圖,即使他們只建立一個圖。
在本教程中,你將學習使用 matplotlib 包提供的子圖功能,以在 Python 中在一個圖形中建立和顯示多個圖。
使用 Matplotlib 中的 subplots() 方法建立繪圖
當你嘗試繪製多個子圖時,它會多次發生,因此你發現使用迴圈和自動繪製多個圖非常困難。
要建立繪圖,我們將使用以下程式碼將別名 matplotlib.pyplot 匯入為 "plt"。
import matplotlib.pyplot as plt
匯入 matplotlib.pyplot 後。使用 'seabourn' 樣式讓這些圖看起來稍微好一些。
plt.style.use("seaborn")
subplots() 方法有助於在單個視窗或圖形中建立多個繪圖,並且此方法返回兩個內容。第一個是圖形,第二個是軸,用於在不同軸上建立子圖。
我們還沒有定義應該在圖中建立多少行和列,因為這是用於基本理解 Matplotlib 的單圖示例。在下一小節中,我們將瞭解如何在一個圖中建立多個圖。
以下程式碼 subplots() 方法採用 figsize 引數。此引數接受具有寬度和高度的元組。
fig, axes = plt.subplots(figsize=(6, 4))
我們將為帶有數值資料的 x1 和 y1 變數建立依賴和獨立列表變數(x 和 y 座標)。
x1 = [0, 4, 8, 12, 16, 20, 24]
y1 = [8, 1, 10, 5, 12, 16, 7]
以下程式碼示例是 Matplotlib 中的單線圖。
示例程式碼:
import matplotlib.pyplot as plt

# use stylish plot from seaborn
plt.style.use("seaborn")

# create single plot in a figure
fig, axes = plt.subplots(figsize=(6, 4))

x1 = [0, 4, 8, 12, 16, 20, 24]
y1 = [8, 1, 10, 5, 12, 16, 7]
# Creates a line plot
axes.plot(x1, y1)
# set the title of appeared window
axes.set_title("A single Line-plot")

plt.show()
輸出:
-Method-in-Matplotlib.webp)
使用 Matplotlib 在一個方向上建立兩個子圖
在 Matplotlib 中,圖形是儲存我們繪圖的容器。你可以將其視為執行程式碼時向我們顯示的整個視窗。
軸是實際的圖,因此一個圖形可以有多個圖。現在我們將看到如何在一個圖中處理兩個圖。
要在 Matplotlib 中建立多個圖,我們需要使用兩個變數定義 subplots() 方法。
fig, axes = plt.subplots(2, figsize=(6, 4))
subplots() 方法的前兩個引數是可選的。在上面的程式碼中,我們在一行中建立了兩個圖。
預設情況下,如果我們不定義這些值,行和列的值將是 1。
現在我們將使用 axes 變數設定繪圖的軸,axes 就像給定索引可以下注的陣列。每個軸將單獨顯示繪圖。
axes[0].plot(x1, y1)
axes[1].plot(x2, y2)
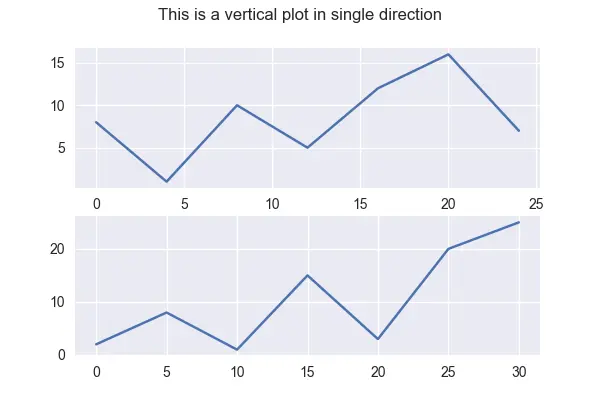
下面是單個方向上兩個垂直子圖的片段。
示例程式碼:
import matplotlib.pyplot as plt

# use stylish plot from seaborn
plt.style.use("seaborn")

# create single plot in a figure
fig, axes = plt.subplots(2, figsize=(6, 4))

x1 = [0, 4, 8, 12, 16, 20, 24]
y1 = [8, 1, 10, 5, 12, 16, 7]

# second dataset

x2 = [0, 5, 10, 15, 20, 25, 30]
y2 = [2, 8, 1, 15, 3, 20, 25]

# Creates a line plot
axes[0].plot(x1, y1)
axes[1].plot(x2, y2)

# displays a super title on top of the figure
fig.suptitle("This is a vertical plot in single direction")
plt.show()
輸出:
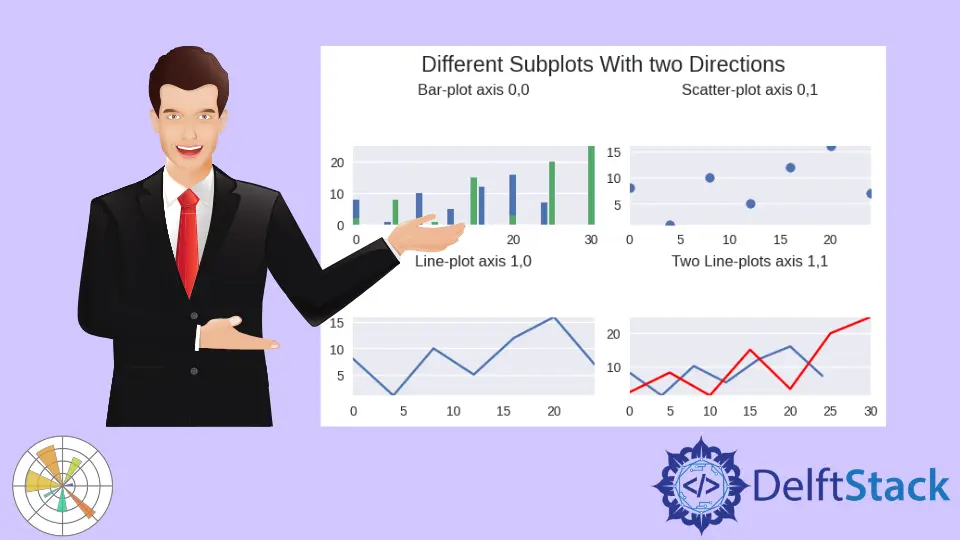
在 Matplotlib 中的一個圖中建立多個子圖
預設情況下,子圖建立一個圖形,然後指定一定數量的軸的行和列。如果不傳入我們的行數和列數,預設是一個一個的,所以一行一列就是一個軸。
讓我們更新我們的程式碼以在我們剛剛使用 subplots() 方法建立的多個軸上繪圖。我們在此程式碼中使用最簡單的方法來使用帶有子圖的軸。
為了簡短起見,我們用一行程式碼來演示如何在 Matplotlib 中使用軸來顯示多個子圖。我們可以將此程式碼與二維陣列相關聯。
子圖已被限制為二維,因為我們建立了一個 2 乘 2 的子圖,因此我們不能給出大於兩個的子圖。我們可以使用相同的軸方法單獨設定子圖的標題。
axes[0][0].bar(x1, y1)
這是本節的完整原始碼。
示例程式碼:
import matplotlib.pyplot as plt

# use stylish plot from seaborn
plt.style.use("seaborn")

# create single plot in a figure
fig, axes = plt.subplots(2, 2, figsize=(6, 4), constrained_layout=True)

x1 = [0, 4, 8, 12, 16, 20, 24]
y1 = [8, 1, 10, 5, 12, 16, 7]

# second dataset

x2 = [0, 5, 10, 15, 20, 25, 30]
y2 = [2, 8, 1, 15, 3, 20, 25]

# set the title of appeared window
axes[0][0].set_title("Bar-plot axis 0,0")
axes[0][1].set_title("Scatter-plot axis 0,1")
axes[1][0].set_title("Line-plot axis 1,0")
axes[1][1].set_title("Two Line-plots axis 1,1")

# Creates a line plot
axes[0][0].bar(x1, y1)
axes[0][0].bar(x2, y2)
axes[0][1].scatter(x1, y1)
axes[1][0].plot(x1, y1)
axes[1][1].plot(x1, y1)
axes[1][1].plot(x2, y2, color="red")

# displays a super title on top of the figure
fig.suptitle("Different Subplots With two Directions")
plt.show()
輸出:

點選這裡閱讀關於子圖的官方文件。

Hello! I am Salman Bin Mehmood(Baum), a software developer and I help organizations, address complex problems. My expertise lies within back-end, data science and machine learning. I am a lifelong learner, currently working on metaverse, and enrolled in a course building an AI application with python. I love solving problems and developing bug-free software for people. I write content related to python and hot Technologies.
LinkedIn