How to Create Multiple Subplots Using Matplotlib
-
Create a Plot Using the
subplots()Method in Matplotlib - Create Two Subplots in One Direction With Matplotlib
- Create Multiple Subplots in One Figure in Matplotlib
If you want additional plots or work with more object-oriented plots, it is best to create your plots with the subplots method. Many people prefer to create their plots this way, even if they only create a single plot.
In this tutorial, you’ll learn to work with the subplot functionality provided with the matplotlib package to create and display multiple plots in one figure in Python.
Create a Plot Using the subplots() Method in Matplotlib
It happens multiple times when you are trying to plot multiple subplots, so you find it very difficult to work with loops and automate plotting multiple plots.
To create plots, we will import matplotlib.pyplot the alias as "plt" using the following code.
import matplotlib.pyplot as plt
After importing matplotlib.pyplot. Use the 'seabourn' style for these plots to look slightly better.
plt.style.use("seaborn")
The subplots() method helps create multiple plots in a single window or figure, and this method returns two things. The first is a figure, and the second is an axis to create subplots on different axes.
We have not defined how many rows and columns should be created in a figure because this is the single plot example for basic understanding with Matplotlib. In the next subsection, we’ll look at how to create multiple plots in one figure.
The following code subplots() method takes the figsize parameter. This parameter accepts a tuple with width and height.
fig, axes = plt.subplots(figsize=(6, 4))
We will create dependent and independent list variables (x and y coordinates) for the x1 and y1 variables with numeric data.
x1 = [0, 4, 8, 12, 16, 20, 24]
y1 = [8, 1, 10, 5, 12, 16, 7]
The following code example is a single line-plot in Matplotlib.
Example Code:
import matplotlib.pyplot as plt

# use stylish plot from seaborn
plt.style.use("seaborn")

# create single plot in a figure
fig, axes = plt.subplots(figsize=(6, 4))

x1 = [0, 4, 8, 12, 16, 20, 24]
y1 = [8, 1, 10, 5, 12, 16, 7]
# Creates a line plot
axes.plot(x1, y1)
# set the title of appeared window
axes.set_title("A single Line-plot")

plt.show()
Output:
-Method-in-Matplotlib.webp)
Create Two Subplots in One Direction With Matplotlib
In Matplotlib, the figure is the container holding our plots. You can think of that as that whole window that shows us when we run our code.
The axes are the actual plots so that a figure can have multiple plots. Now we will see how to work with two plots within one figure.
To create multiple plots in Matplotlib, we need to define the subplots() method with two variables.
fig, axes = plt.subplots(2, figsize=(6, 4))
The first two parameters of the subplots() method are optional. In the above code, we create two plots in a single row.
By default, the row and column value would be 1 if we do not define those values.
Now we will set the axis of the plot with the axes variable, and the axes are like an array that the given index can bet. Every axis will display the plot individually.
axes[0].plot(x1, y1)
axes[1].plot(x2, y2)
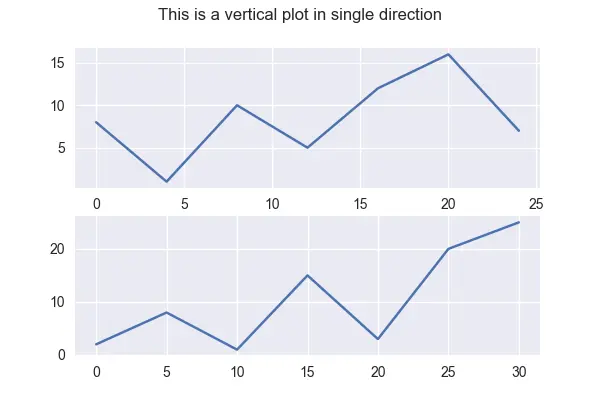
Below is a snippet of the two vertical subplots in a single direction.
Example Code:
import matplotlib.pyplot as plt

# use stylish plot from seaborn
plt.style.use("seaborn")

# create single plot in a figure
fig, axes = plt.subplots(2, figsize=(6, 4))

x1 = [0, 4, 8, 12, 16, 20, 24]
y1 = [8, 1, 10, 5, 12, 16, 7]

# second dataset

x2 = [0, 5, 10, 15, 20, 25, 30]
y2 = [2, 8, 1, 15, 3, 20, 25]

# Creates a line plot
axes[0].plot(x1, y1)
axes[1].plot(x2, y2)

# displays a super title on top of the figure
fig.suptitle("This is a vertical plot in single direction")
plt.show()
Output:
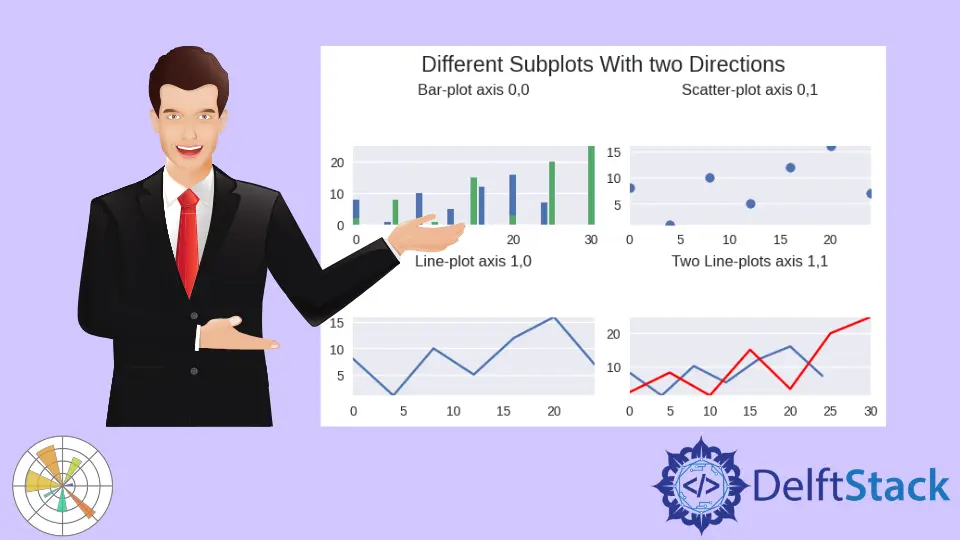
Create Multiple Subplots in One Figure in Matplotlib
By default, subplots create a figure and then specify a certain number of rows and columns of axes. If we do not pass in our number of rows and columns, it defaults to one by one, so one row and one column are simply one axis.
Let’s update our code to plot on multiple axes that we just created using the subplots() method. We use the easiest approach in this code to use axes with a subplot.
To keep it short and simple, we take one line of code to demonstrate how to work axes to display multiple subplots in Matplotlib. We can relate this code to a two-dimensional array.
The subplot has been limited to two dimensions because we created a subplot to 2 by 2, so we can not give the higher more than two. We can set the title of subplots individually just using the same axes approach.
axes[0][0].bar(x1, y1)
Here is the complete source code of this section.
Example Code:
import matplotlib.pyplot as plt

# use stylish plot from seaborn
plt.style.use("seaborn")

# create single plot in a figure
fig, axes = plt.subplots(2, 2, figsize=(6, 4), constrained_layout=True)

x1 = [0, 4, 8, 12, 16, 20, 24]
y1 = [8, 1, 10, 5, 12, 16, 7]

# second dataset

x2 = [0, 5, 10, 15, 20, 25, 30]
y2 = [2, 8, 1, 15, 3, 20, 25]

# set the title of appeared window
axes[0][0].set_title("Bar-plot axis 0,0")
axes[0][1].set_title("Scatter-plot axis 0,1")
axes[1][0].set_title("Line-plot axis 1,0")
axes[1][1].set_title("Two Line-plots axis 1,1")

# Creates a line plot
axes[0][0].bar(x1, y1)
axes[0][0].bar(x2, y2)
axes[0][1].scatter(x1, y1)
axes[1][0].plot(x1, y1)
axes[1][1].plot(x1, y1)
axes[1][1].plot(x2, y2, color="red")

# displays a super title on top of the figure
fig.suptitle("Different Subplots With two Directions")
plt.show()
Output:

Click here to read the official documentation about subplots.

Hello! I am Salman Bin Mehmood(Baum), a software developer and I help organizations, address complex problems. My expertise lies within back-end, data science and machine learning. I am a lifelong learner, currently working on metaverse, and enrolled in a course building an AI application with python. I love solving problems and developing bug-free software for people. I write content related to python and hot Technologies.
LinkedIn