How to Create Different Subplot Sizes in Matplotlib
-
gridspecMethod to Set Different Matplotlib Subplot Size -
gridspec_kwMethod -
subplot2gridMethod to Set Different Matplotlib Subplot Size

We could use gridspec_kw, gridspec, and subplot2grid to specify different ratios of subplots to create different subplots size in Matplotlib.
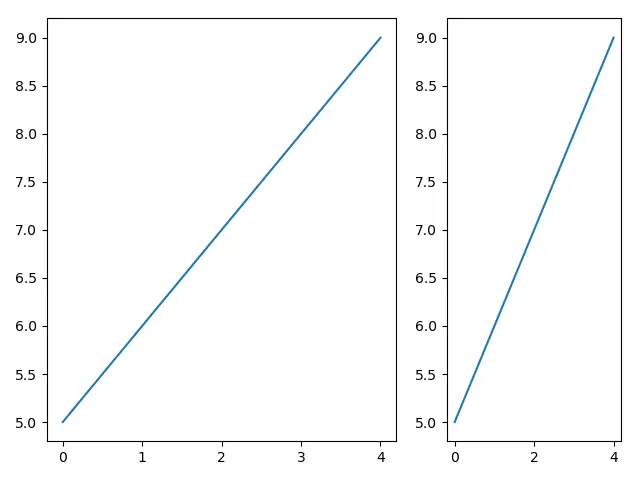
gridspec Method to Set Different Matplotlib Subplot Size
import matplotlib.pyplot as plt
from matplotlib import gridspec

fig = plt.figure()
spec = gridspec.GridSpec(ncols=2, nrows=1, width_ratios=[2, 1])

ax0 = fig.add_subplot(spec[0])
ax0.plot(range(5), range(5, 10))
ax1 = fig.add_subplot(spec[1])
ax1.plot(range(5), range(5, 10))

plt.show()
GridSpec from the gridspec module specifies the geometry of the subplots grid. We could set the number of rows, columns, and layout parameters like width and height ratio.
spec = gridspec.GridSpec(ncols=2, nrows=1, width_ratios=[2, 1])
It specifies the figure has two columns and one row and the width ratio is 2:1.
ax0 = fig.add_subplot(spec[0])
The ax0 object takes the place of position 0 in the geometry as defined above, or you could use spec[0, 0] to make it clearer.
gridspec_kw Method
import matplotlib.pyplot as plt

fig, ax = plt.subplots(
    2, 2, gridspec_kw={"width_ratios": [2, 1], "height_ratios": [1, 2]}
)

ax[0][0].plot(range(5), range(5, 10))
ax[0][1].plot(range(5), range(10, 5, -1))
ax[1][0].plot(range(5), range(5, 10))
ax[1][1].plot(range(5), range(10, 5, -1))

plt.show()
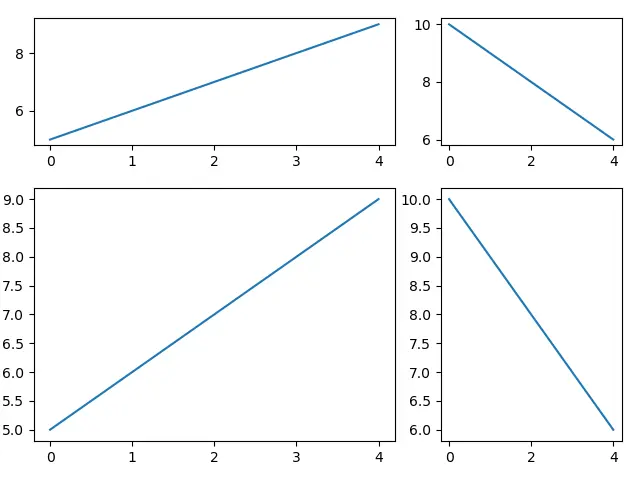
gridspec_kw is the dictionary with keywords for the GridSpec constructor to specify the subplots’ gird.
The width ratio is specified as 2:1, and the height ratio is set to be 1:2.
subplot2grid Method to Set Different Matplotlib Subplot Size
subplot2grid lets subplots take multiple cells in the 0-based grid indexing.
def subplot2grid(shape,
                 loc,
                 rowspan=1,
                 colspan=1,
                 fig=None,
                 **kwargs):
shape is the shape of the grid and has the sequence of 2 integers whose first element is the number of rows and second is the number of columns.
loc is the location to place the axis in the grid. It is also the sequence of 2 integers whose first entry is row number, and the second element is column number.
rowspan and colspan are the number of rows or columns for the axis to span to the right (for rowspan) or the bottom (for colspan).
Working Coding Example:
import matplotlib.pyplot as plt

fig = plt.figure()

ax0 = plt.subplot2grid((1, 5), (0, 0), colspan=3)
ax1 = plt.subplot2grid((1, 5), (0, 3), colspan=2)

ax0.plot(range(5), range(5, 10))
ax1.plot(range(5), range(10, 5, -1))

plt.show()
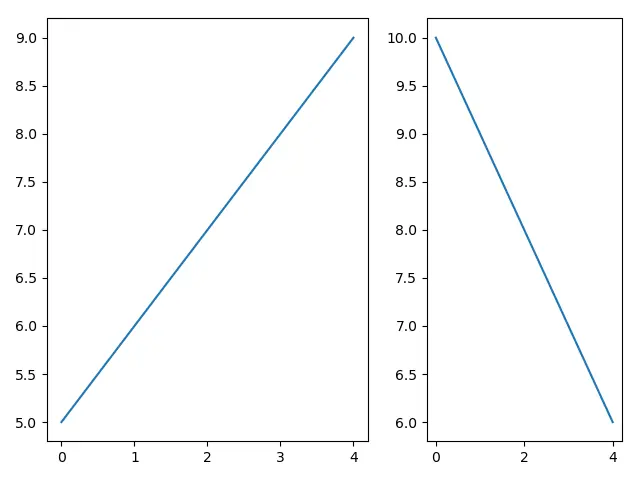
ax0 = plt.subplot2grid((1, 5), (0, 0), colspan=3)
ax1 = plt.subplot2grid((1, 5), (0, 3), colspan=2)
The grid has the shape of (1, 5) with one row and five columns.
ax0 is placed at (0, 0) cell and takes three columns, and ax1 is placed at (0, 3) and takes the other two columns.

Founder of DelftStack.com. Jinku has worked in the robotics and automotive industries for over 8 years. He sharpened his coding skills when he needed to do the automatic testing, data collection from remote servers and report creation from the endurance test. He is from an electrical/electronics engineering background but has expanded his interest to embedded electronics, embedded programming and front-/back-end programming.
LinkedIn Facebook