Matplotlib で図にサブプロットを追加する
-
matplotlib.pyplot.figure.add_subplot()メソッドを使って図にサブプロットを追加する -
Matplotlib.pyplot.subplots()を用いてサブプロットを持つ図を作成する
このチュートリアルでは、Python の matplotlib.pyplot.figure.add_subplot() メソッドを使って Matplotlib の図にサブプロットを追加する方法を説明します。
matplotlib.pyplot.figure.add_subplot() メソッドを使って図にサブプロットを追加する
import matplotlib.pyplot as plt

fig = plt.figure(figsize=(5, 5))

x = [1, 2, 3, 4, 5]
y = [2, 4, 5, 1, 2]

subplot = fig.add_subplot(1, 1, 1)
subplot.plot(x, y)

fig.suptitle("Figure with only one Subplot")
plt.show()
出力:
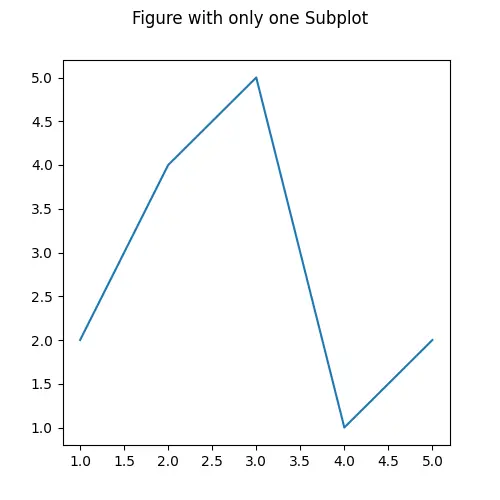
1つのサブプロットのみを持つ図を生成します。図は、図に含まれるすべてのサブプロットやその他の要素を含む高レベルの要素として解釈することができます。まず、サイズ (5,5) の図オブジェクトを初期化し、add_subplot() メソッドを用いてサブプロットを追加します。add_subplot() メソッドの第 1 引数は図中のサブプロットの行数、第 2 引数はサブプロットの列数、第 3 引数はグリッド上のサブプロットの位置を表します。
ここでは、fig.add_subplot(1,1,1) は最初の位置にサブプロットを追加します。また、fig.add_subplot(111) を用いても同様の結果が得られます。add_subplot() メソッドは axes オブジェクトを返します。
import matplotlib.pyplot as plt

fig = plt.figure(figsize=(8, 6))

ax_1 = fig.add_subplot(121)
ax_1.text(0.3, 0.5, "subplot(121)")

ax_2 = fig.add_subplot(222)
ax_2.text(0.3, 0.5, "subplot(222)")

ax_3 = fig.add_subplot(224)
ax_3.text(0.3, 0.5, "subplot(224)")

fig.suptitle("Figure with multiple Subplots")
plt.show()
出力:

ここでは、3つのサブプロットを持つ図形があります。1つ目のサブプロットは、1 行 2 列のグリッド内の 1 番目の図を表しています。2 番目のサブプロットは、2 行 2 列のグリッド内の 2 番目の図を表しています。同様に、3 行目は 2 行 2 列のグリッド内の 4 番目の位置にあるサブプロットを表します。
Matplotlib.pyplot.subplots() を用いてサブプロットを持つ図を作成する
また、Matplotlib.pyplot.subplots() も図にサブプロットを追加します。このメソッドには行と列の数を引数として渡し、そのメソッドは図オブジェクトと軸オブジェクトを返します。
import matplotlib.pyplot as plt

fig, ax = plt.subplots(2, 1)

ax[0].text(0.3, 0.5, "1st Subplot")
ax[0].set_xticks([])
ax[0].set_yticks([])

ax[1].text(0.3, 0.5, "2nd Subplot")
ax[1].set_xticks([])
ax[1].set_yticks([])

fig.suptitle("Figure with 2 subplots", fontsize=16)
plt.show()
出力:
subplots() メソッドを用いて、2 行 1 列のグリッド上に 2つのサブプロットを持つ図を生成します。1つ目のサブプロットまたは上部の軸は ax リストの 1 番目の要素で、2つ目のサブプロットまたは下部の軸は ax リストの 2 番目の要素で操作することができます。
import matplotlib.pyplot as plt

x = [1, 2, 3, 4, 5]
y1 = [i ** 2 for i in x]
y2 = [4 * i + 1 for i in x]

fig, ax = plt.subplots(2, 1)

ax[0].plot(x, y1)
ax[0].set_xlabel("X")
ax[0].set_ylabel("Y")

ax[1].plot(x, y2)
ax[1].set_xlabel("X")
ax[1].set_ylabel("Y")

plt.tight_layout()
plt.show()
出力:
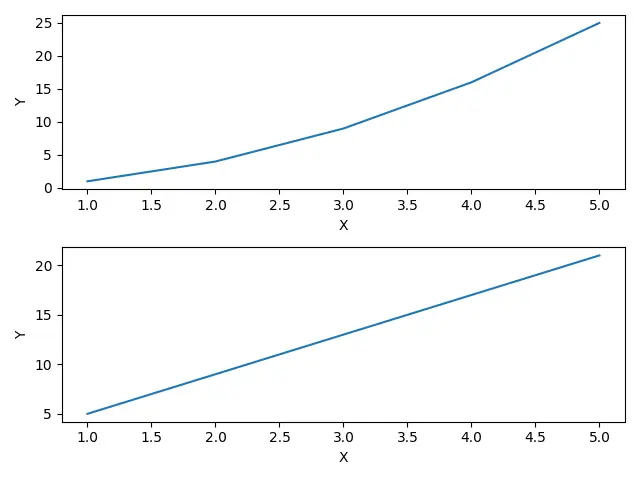
これは、2つのサブプロットを持つ図を生成し、上のサブプロットに x^2 関数をプロットし、下のサブプロットに 4x+1 関数をプロットします。

Suraj Joshi is a backend software engineer at Matrice.ai.
LinkedIn