How to Plot and Save a Graph in High Resolution in Matplotlib

To save a graph in high resolution in Matplotlib, we control various parameters of savefig() function. Similarly, we can plot graphs in high resolution by setting a high value of dpi parameter in figure() function.
Plot Graph in High Resolution in Matplotlib
We can plot figures in high resolutions by setting high values of dpi in matplotlib.pyplot.figure() function.
Syntax of matplotlib.pyplot.figure():
matplotlib.pyplot.figure(num=None,
                         figsize=None,
                         dpi=None,
                         facecolor=None,
                         edgecolor=None,
                         frameon=True,
                         FigureClass=<class 'matplotlib.figure.Figure'>,
                         **kwargs)
dpi stands for dots per inch. It represents the number of pixels per inch in the figure. The default value for dpi in matplotlib.pyplot.figure() function is 100. We can set higher values of dpi to generate high-resolution plots. However, increasing dpi will also magnify the figure and we have to tune the appropriate value of dpi so that figure might not get clipped.
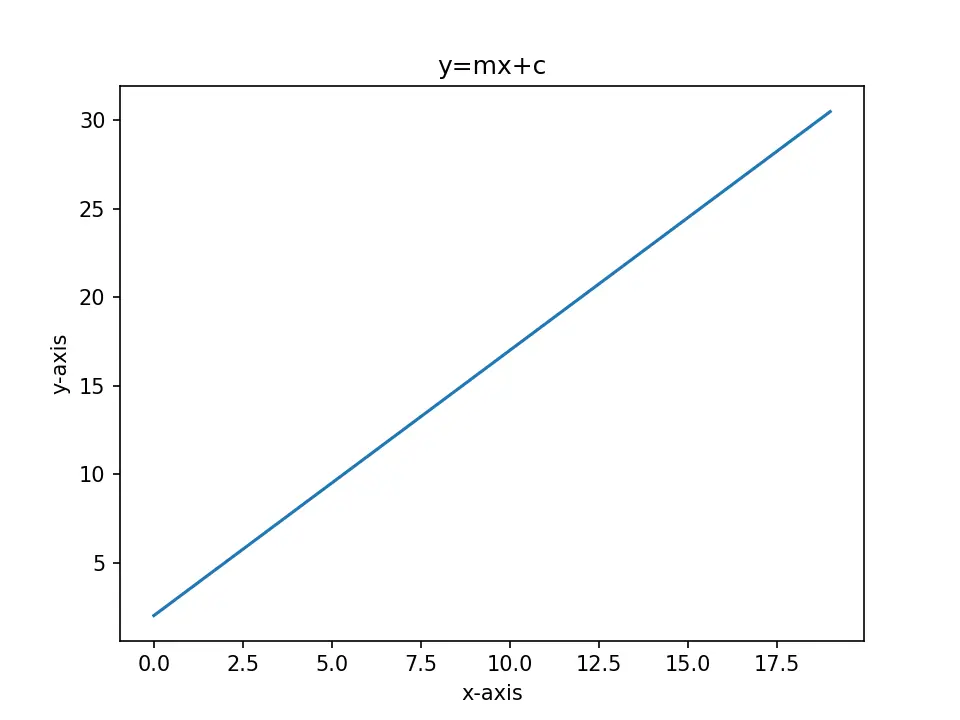
import numpy as np
import matplotlib.pyplot as plt

x = np.arange(0, 20)
m = 1.5
c = 2
y = m * x + c

plt.figure(dpi=150)
plt.plot(x, y)
plt.title("y=mx+c")
plt.xlabel("x-axis")
plt.ylabel("y-axis")

plt.show()
Output:
Save Figure in High Resolution in Matplotlib
We can plot figures in high resolutions by setting high values of dpi in matplotlib.pyplot.savefig() function.
Syntax of matplotlib.pyplot.savefig():
matplotlib.pyplot.savefig(fname,
                          dpi=None,
                          facecolor='w',
                          edgecolor='w',
                          orientation='portrait',
                          papertype=None,
                          format=None,
                          transparent=False,
                          bbox_inches=None,
                          pad_inches=0.1,
                          frameon=None,
                          metadata=None)
We can control the resolution of the saved figure through dpi parameter in savefig() function. Similarly, we can also vary formats while saving the plot. Generally, pngs are better than jpeg for high-resolution plots as png is a lossless compression format and the other being lossy compression format.
import numpy as np
import matplotlib.pyplot as plt

x = np.arange(0, 5)
m = 1.5
c = 2
y = m * x + c

plt.plot(x, y)
plt.title("y=mx+c")
plt.xlabel("x-axis")
plt.ylabel("y-axis")
plt.savefig("High resoltion.png", dpi=300)
This saves the plot as High resoltion.png in the current working directory with higher resolution than the default case.

Suraj Joshi is a backend software engineer at Matrice.ai.
LinkedIn