How to Use of pyplot.figure() in Matplotlib
- Understanding pyplot.figure()
- Customizing Figure Size and Resolution
- Changing Background Color and Style
- Utilizing Subplots with pyplot.figure()
- Conclusion
- FAQ

Matplotlib is a powerful library in Python for creating static, animated, and interactive visualizations. One of the essential functions in this library is pyplot.figure(), which allows you to create a new figure for your plots. Understanding how to use this function effectively can dramatically enhance your plotting capabilities.
In this tutorial, we will delve into the various properties you can modify using pyplot.figure(), such as figure size, resolution, and background color. Whether you’re a beginner or looking to refine your skills, this guide will equip you with the knowledge to create stunning visualizations with Matplotlib.
Understanding pyplot.figure()
The pyplot.figure() function is your gateway to creating a new figure in Matplotlib. By default, when you call this function, it generates a new figure window. However, it also provides several parameters that allow you to customize the figure to suit your needs.
Here’s a simple example of how to create a basic figure and modify its size:
import matplotlib.pyplot as plt

x = [1, 2, 3, 4, 5, 6]
y = [4, 3, 5, 6, 7, 4]

plt.figure(figsize=(8, 6), facecolor="yellow")

plt.plot(x, y)
plt.xlabel("X")
plt.ylabel("Y")
plt.title("Plot with figsize (8,6)")
plt.show()
Output:
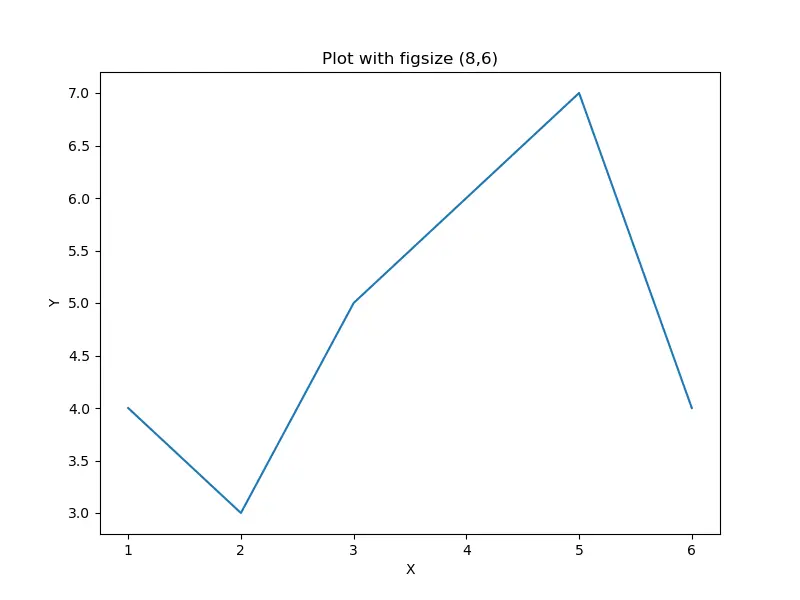
In this example, we create a figure with a size of 8 inches wide and 6 inches tall. The figsize parameter is a tuple that specifies the width and height in inches. The face color is set to be yellow. The plt.plot() function is used to plot a simple line graph. Finally, the show() method displays the figure.
By utilizing pyplot.figure(), you can easily control the dimensions of your visualizations, making them suitable for different formats like presentations or reports.
Customizing Figure Size and Resolution
One of the most significant advantages of using pyplot.figure() is the ability to customize the figure size and resolution. The dpi (dots per inch) parameter allows you to adjust the resolution of your figure, which is crucial when saving your plots for publication or high-quality presentations.
Here’s how you can set the figure size and resolution:
import matplotlib.pyplot as plt

plt.figure(figsize=(12, 6), dpi=100)
plt.plot([1, 2, 3], [1, 4, 9], marker='o')
plt.title("Customized Figure Size and DPI")
plt.xlabel("X-axis")
plt.ylabel("Y-axis")
plt.grid(True)
plt.show()
Output:
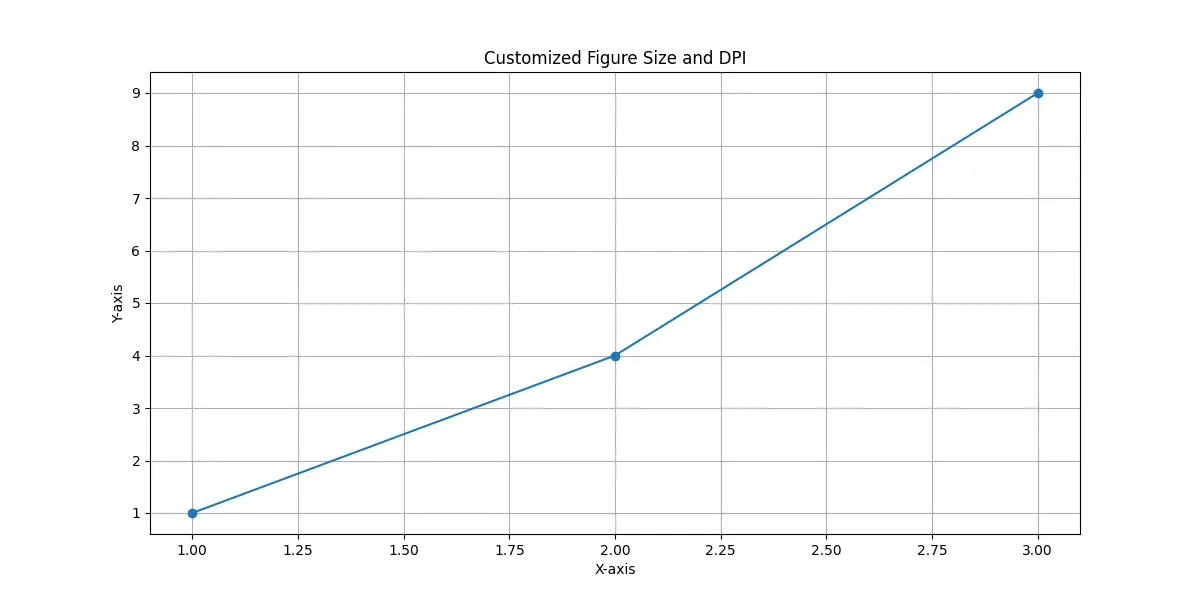
In this example, we set the figure size to 12 inches wide and 6 inches tall, with a resolution of 100 dpi. The marker='o' argument in the plt.plot() function adds circular markers to the data points. The plt.grid(True) function adds a grid to the plot, enhancing its readability.
By adjusting the dpi, you can create figures that look crisp and clear when printed or displayed on high-resolution screens. This customization is particularly valuable for academic papers and professional presentations.
Changing Background Color and Style
Another powerful feature of pyplot.figure() is the ability to change the background color and style of your figures. This can significantly affect the visual appeal and clarity of your plots. You can set the face color and edge color of the figure, as well as choose from various styles available in Matplotlib.
Here’s an example of how to customize the background color:
import matplotlib.pyplot as plt

plt.figure(facecolor='lightblue', edgecolor='black')
plt.plot([1, 2, 3], [1, 4, 9], color='darkblue')
plt.title("Figure with Custom Background Color")
plt.xlabel("X-axis")
plt.ylabel("Y-axis")
plt.show()
Output:
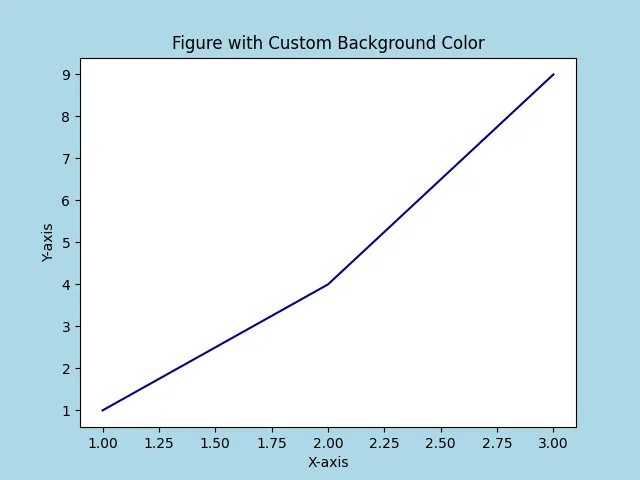
In this code snippet, we set the facecolor parameter to ’lightblue’ and the edgecolor to ‘black’. The plot line is colored dark blue for contrast. This customization not only makes the plot visually appealing but also helps in highlighting the data against the background.
You can explore various color options to see what works best for your data. Additionally, you can apply different styles using the plt.style.use() function, allowing you to create consistent and professional-looking plots.
Utilizing Subplots with pyplot.figure()
When working with multiple plots, pyplot.figure() can be used in conjunction with subplots to create a more organized layout. The plt.subplots() function allows you to define a grid of plots within a single figure, which is particularly useful for comparing multiple datasets.
Here’s an example of how to create subplots:
import matplotlib.pyplot as plt

x = [1, 2, 3, 4, 5, 6]
y = [4, 3, 5, 6, 7, 4]

fig = plt.figure()

subplot1 = fig.add_subplot(2, 1, 1)
subplot1.plot(x, y)

subplot2 = fig.add_subplot(2, 1, 2)
subplot2.text(0.3, 0.5, "2nd Subplot")

fig.suptitle("Add subplots to a figure")
plt.show()
Output:
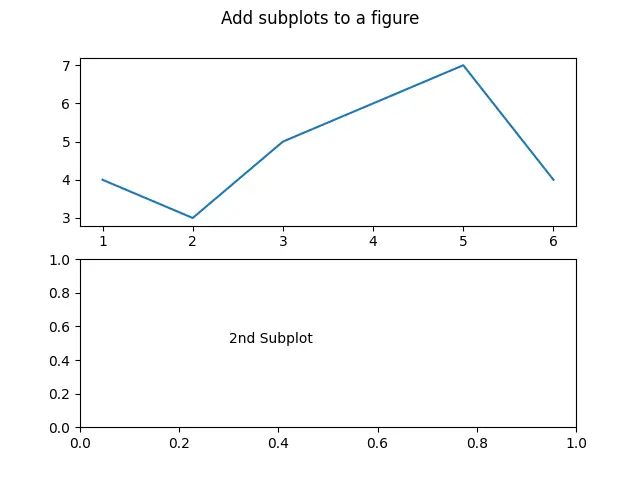
It adds two subplots to the figure object fig created using the matplotlib.pyplot.figure() method.
In this example, we create a figure and add two subplots side by side. The add_subplot(2, 1, 1) method specifies that we want two rows and one column, and we’re adding the first subplot.
Using subplots is an excellent way to present related data in a cohesive manner, making it easier for your audience to draw comparisons and insights.
Conclusion
Mastering the use of pyplot.figure() in Matplotlib can significantly enhance your data visualization skills. From customizing figure sizes and resolutions to changing background colors and creating subplots, this function provides a robust framework for generating professional-grade plots. By leveraging these features, you can create visualizations that not only convey data effectively but also captivate your audience.
As you continue to explore Matplotlib, remember that practice is key. Experiment with different parameters and styles to discover what works best for your projects. Happy plotting!
FAQ
-
what is pyplot.figure() in Matplotlib?
pyplot.figure() creates a new figure for your plots and allows customization of properties like size and background color. -
how can I change the size of a figure in Matplotlib?
You can change the size by using the figsize parameter in pyplot.figure(), specifying the width and height in inches. -
what does the dpi parameter do in pyplot.figure()?
The dpi parameter controls the resolution of the figure, affecting how sharp and clear the plot appears when displayed or printed. -
can I create multiple plots in a single figure using pyplot.figure()?
Yes, you can create multiple plots in a single figure by using the plt.subplots() function in conjunction with pyplot.figure(). -
how do I change the background color of a Matplotlib figure?
You can change the background color by using the facecolor parameter in pyplot.figure().

Suraj Joshi is a backend software engineer at Matrice.ai.
LinkedIn