使用 Matplotlib 中的 pyplot.figure()
Suraj Joshi
2023年1月30日
Matplotlib
Matplotlib Figure

本教程解釋了我們如何使用 matplotlib.pyplot.fig() 來改變 Matplotlib 圖的各種屬性。一個 Matplotlib 圖只是一個頂層的容器,它包含了一個圖的所有軸和屬性。要了解更多關於 Matplotlib 圖的細節,可以參考官方文件頁。
使用 matplotlib.pyplot.fig() 來設定圖的屬性
matplotlib.pyplot.figure(num=None,
                         figsize=None,
                         dpi=None,
                         facecolor=None,
                         edgecolor=None,
                         frameon=True,
                         FigureClass= < class 'matplotlib.figure.Figure' > ,
                         clear=False,
                         **kwargs)
我們可以使用 matplotlib.pyplot.figure() 來建立一個新的圖形,並設定各種引數的值來定製圖形,如 figsize,dpi 等。
示例:使用 matplotlib.pyplot.figure() 設定圖形屬性
import matplotlib.pyplot as plt

x = [1, 2, 3, 4, 5, 6]
y = [4, 3, 5, 6, 7, 4]

plt.figure(figsize=(8, 6), facecolor="yellow")

plt.plot(x, y)
plt.xlabel("X")
plt.ylabel("Y")
plt.title("Plot with figsize (8,6)")
plt.show()
輸出:
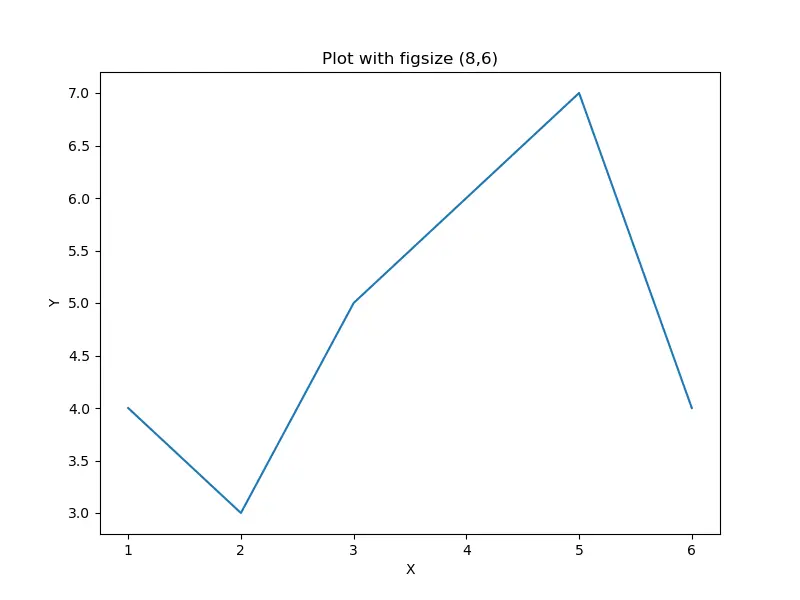
它建立了圖形物件,並將人物的寬度設定為 8 英寸,高度設定為 6 英寸。人臉顏色設定為黃色。
使用 matplotlib.pyplot.fig() 像圖形新增子圖
matplotlib.pyplot.figure() 返回一個圖形物件,這個物件可以用來使用 add_subplot() 方法向圖中新增子圖。
import matplotlib.pyplot as plt

x = [1, 2, 3, 4, 5, 6]
y = [4, 3, 5, 6, 7, 4]

fig = plt.figure()

subplot1 = fig.add_subplot(2, 1, 1)
subplot1.plot(x, y)

subplot2 = fig.add_subplot(2, 1, 2)
subplot2.text(0.3, 0.5, "2nd Subplot")

fig.suptitle("Add subplots to a figure")
plt.show()
輸出:
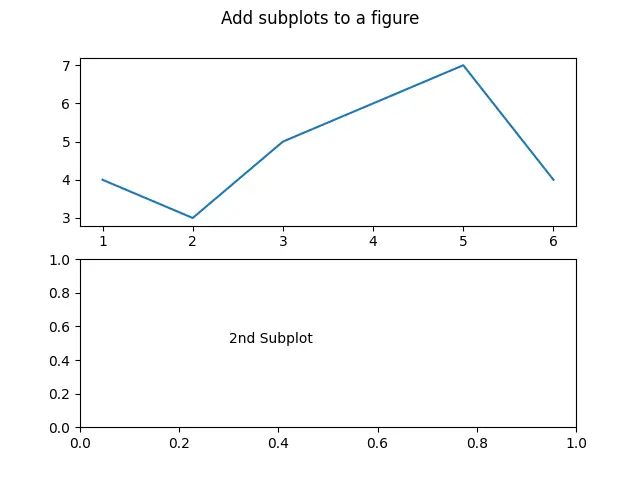
它為使用 matplotlib.pyplot.fig() 方法建立的圖物件 fig 新增了兩個子圖。
Enjoying our tutorials? Subscribe to DelftStack on YouTube to support us in creating more high-quality video guides. Subscribe
作者: Suraj Joshi

Suraj Joshi is a backend software engineer at Matrice.ai.
LinkedIn